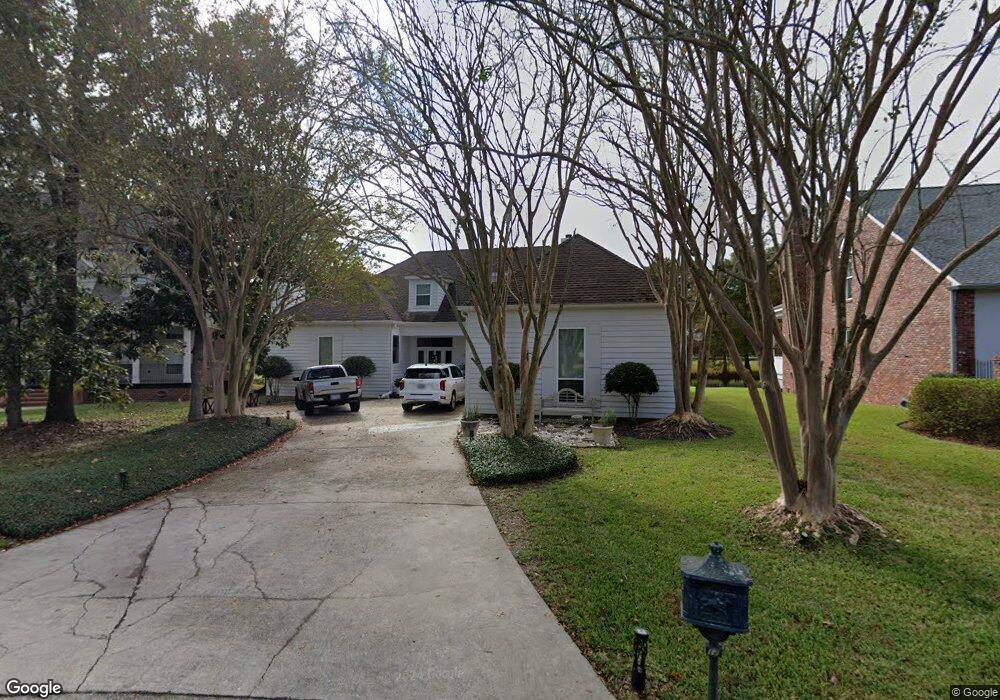
12 Chandon Ct Mandeville, LA 70448
Estimated Value: $379,000 - $461,290
Studio
--
Bath
2,625
Sq Ft
$161/Sq Ft
Est. Value
About This Home
This home is located at 12 Chandon Ct, Mandeville, LA 70448 and is currently estimated at $421,823, approximately $160 per square foot. 12 Chandon Ct is a home located in St. Tammany Parish with nearby schools including Mandeville Elementary School, Lake Harbor Middle School, and Mandeville Junior High School.
Ownership History
Date
Name
Owned For
Owner Type
Purchase Details
Closed on
Dec 7, 2020
Sold by
Fisher Albin C
Bought by
Gurievsky Kyle Kenneth and Gurievsky Carolyn Atkinson
Current Estimated Value
Home Financials for this Owner
Home Financials are based on the most recent Mortgage that was taken out on this home.
Original Mortgage
$250,200
Outstanding Balance
$220,601
Interest Rate
2.8%
Mortgage Type
New Conventional
Estimated Equity
$201,222
Create a Home Valuation Report for This Property
The Home Valuation Report is an in-depth analysis detailing your home's value as well as a comparison with similar homes in the area
Home Values in the Area
Average Home Value in this Area
Purchase History
| Date | Buyer | Sale Price | Title Company |
|---|---|---|---|
| Gurievsky Kyle Kenneth | $278,000 | Crescent Title |
Source: Public Records
Mortgage History
| Date | Status | Borrower | Loan Amount |
|---|---|---|---|
| Open | Gurievsky Kyle Kenneth | $250,200 |
Source: Public Records
Tax History
| Year | Tax Paid | Tax Assessment Tax Assessment Total Assessment is a certain percentage of the fair market value that is determined by local assessors to be the total taxable value of land and additions on the property. | Land | Improvement |
|---|---|---|---|---|
| 2025 | $3,077 | $33,152 | $4,635 | $28,517 |
| 2024 | $3,077 | $33,152 | $4,635 | $28,517 |
| 2023 | $3,191 | $27,634 | $4,635 | $22,999 |
| 2022 | $366,286 | $27,634 | $4,635 | $22,999 |
| 2021 | $3,656 | $27,634 | $4,635 | $22,999 |
| 2020 | $2,661 | $27,634 | $4,635 | $22,999 |
| 2019 | $3,678 | $26,829 | $4,500 | $22,329 |
| 2018 | $3,683 | $26,829 | $4,500 | $22,329 |
| 2017 | $3,718 | $26,829 | $4,500 | $22,329 |
| 2016 | $3,747 | $26,829 | $4,500 | $22,329 |
| 2015 | $2,382 | $24,101 | $4,500 | $19,601 |
| 2014 | $2,357 | $24,101 | $4,500 | $19,601 |
| 2013 | -- | $24,101 | $4,500 | $19,601 |
Source: Public Records
Map
Nearby Homes
Your Personal Tour Guide
Ask me questions while you tour the home.