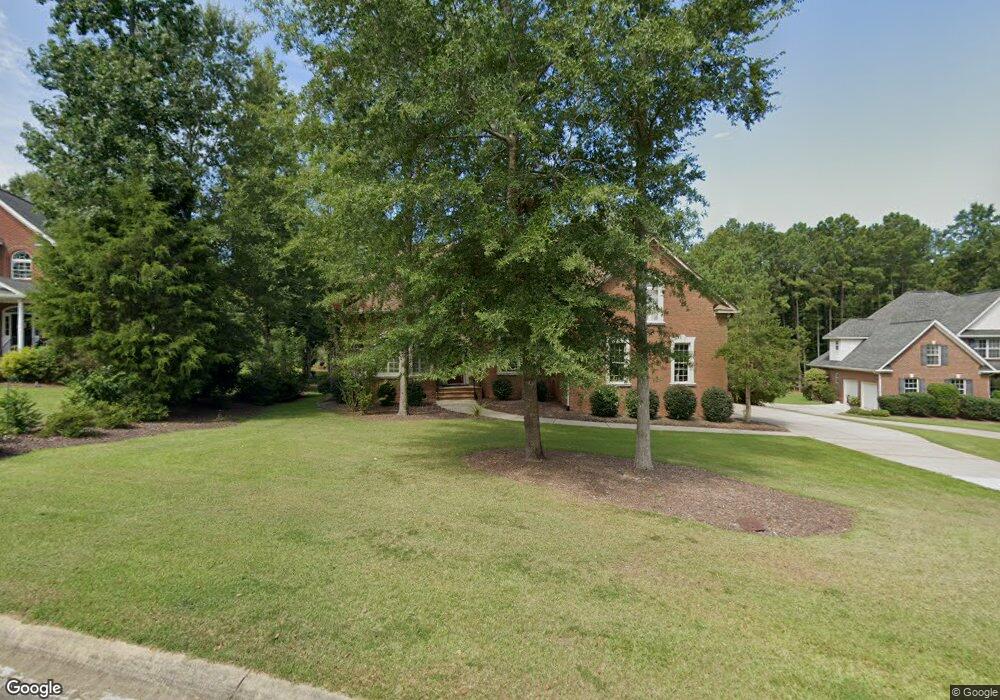
12 Clay Ct Chapin, SC 29036
Estimated Value: $686,000 - $779,000
5
Beds
4
Baths
3,399
Sq Ft
$213/Sq Ft
Est. Value
About This Home
This home is located at 12 Clay Ct, Chapin, SC 29036 and is currently estimated at $724,493, approximately $213 per square foot. 12 Clay Ct is a home located in Lexington County with nearby schools including Lake Murray Elementary School, Chapin Intermediate, and Chapin High School.
Ownership History
Date
Name
Owned For
Owner Type
Purchase Details
Closed on
Jun 25, 2019
Sold by
Smith Andrew P and Smith Michelle M
Bought by
Nickerson Brian G and Nickerson Margaret A
Current Estimated Value
Home Financials for this Owner
Home Financials are based on the most recent Mortgage that was taken out on this home.
Original Mortgage
$270,000
Outstanding Balance
$178,093
Interest Rate
4%
Mortgage Type
New Conventional
Estimated Equity
$546,400
Purchase Details
Closed on
Aug 1, 2012
Sold by
Kodek Ruby Lee Bush
Bought by
Harlin Linda K
Purchase Details
Closed on
Feb 6, 2006
Sold by
Cash Michele D
Bought by
Smith Ii Andrew P and Smith Michelle M
Home Financials for this Owner
Home Financials are based on the most recent Mortgage that was taken out on this home.
Original Mortgage
$308,000
Interest Rate
6.14%
Mortgage Type
New Conventional
Purchase Details
Closed on
Jun 15, 2005
Sold by
S W B Inc
Bought by
Cash Michele D
Create a Home Valuation Report for This Property
The Home Valuation Report is an in-depth analysis detailing your home's value as well as a comparison with similar homes in the area
Home Values in the Area
Average Home Value in this Area
Purchase History
| Date | Buyer | Sale Price | Title Company |
|---|---|---|---|
| Nickerson Brian G | $465,000 | None Available | |
| Harlin Linda K | -- | -- | |
| Smith Ii Andrew P | $385,000 | None Available | |
| Cash Michele D | $50,000 | -- |
Source: Public Records
Mortgage History
| Date | Status | Borrower | Loan Amount |
|---|---|---|---|
| Open | Nickerson Brian G | $270,000 | |
| Previous Owner | Smith Ii Andrew P | $308,000 |
Source: Public Records
Tax History
| Year | Tax Paid | Tax Assessment Tax Assessment Total Assessment is a certain percentage of the fair market value that is determined by local assessors to be the total taxable value of land and additions on the property. | Land | Improvement |
|---|---|---|---|---|
| 2024 | $3,064 | $18,600 | $2,200 | $16,400 |
| 2023 | $2,846 | $18,600 | $2,200 | $16,400 |
| 2022 | $2,871 | $18,600 | $2,200 | $16,400 |
| 2020 | $3,007 | $18,600 | $2,200 | $16,400 |
| 2019 | $2,503 | $15,215 | $2,200 | $13,015 |
| 2018 | $2,203 | $15,215 | $2,200 | $13,015 |
| 2017 | $2,147 | $15,215 | $2,200 | $13,015 |
| 2016 | $2,201 | $15,214 | $2,200 | $13,014 |
| 2014 | $2,074 | $14,402 | $1,610 | $12,792 |
| 2013 | -- | $14,400 | $1,610 | $12,790 |
Source: Public Records
Map
Nearby Homes
- 24 Clay Ct
- 335 Saucer Way
- 306 Dolly Horn Ln
- 110 Lake Hilton Dr
- 116 Rushton Dr
- 812 Village Well Ct
- 646 Village Market Dr
- 2544 Wessinger Rd
- 435 Whits End
- 822 Ruskin Dr
- 142 Almofini Ln
- 515 Malachite Ln
- 53 Starry Night Ct
- 509 Malachite Ln
- 1318 Portrait Hill Dr
- 13 Botticelli Ct
- 175 Almofini Ln
- 705 Ruskin Dr
- 28 Starry Night Ct
- 312 Lanyard Ln
Your Personal Tour Guide
Ask me questions while you tour the home.