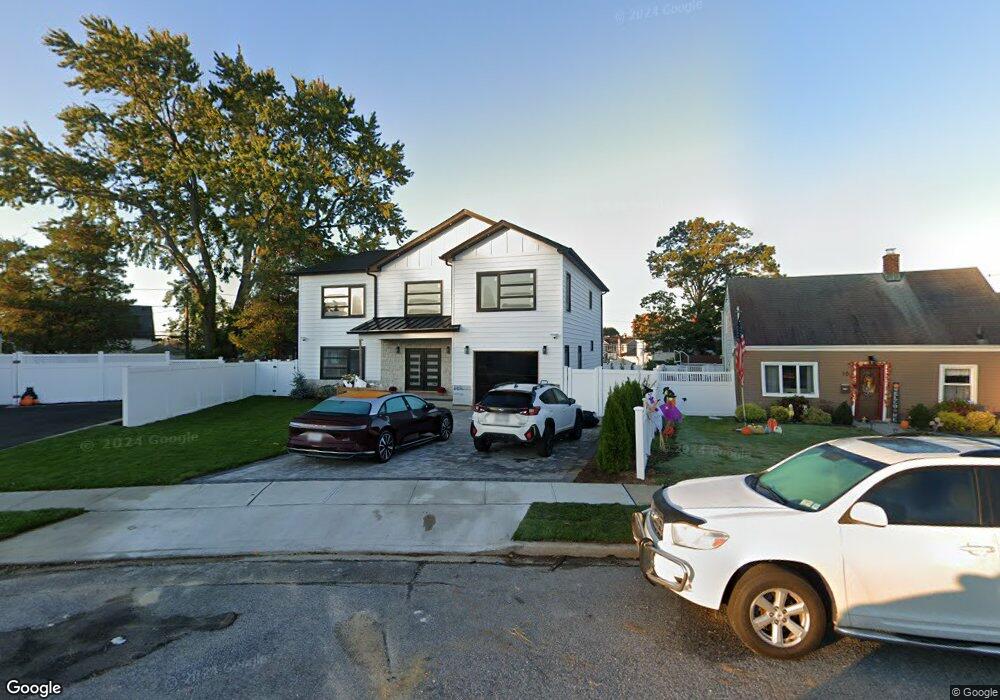
12 Clay Ln Levittown, NY 11756
Estimated Value: $1,308,619 - $1,433,000
Studio
2
Baths
3,091
Sq Ft
$443/Sq Ft
Est. Value
About This Home
This home is located at 12 Clay Ln, Levittown, NY 11756 and is currently estimated at $1,370,810, approximately $443 per square foot. 12 Clay Ln is a home located in Nassau County with nearby schools including Abbey Lane Elementary School, Wisdom Lane Middle School, and Division Avenue Senior High School.
Ownership History
Date
Name
Owned For
Owner Type
Purchase Details
Closed on
Aug 1, 2025
Sold by
Tristate Development Group Llc
Bought by
Mallick Tushar and Varigonda Renuka Vidya
Current Estimated Value
Home Financials for this Owner
Home Financials are based on the most recent Mortgage that was taken out on this home.
Original Mortgage
$916,500
Outstanding Balance
$914,447
Interest Rate
7.5%
Mortgage Type
New Conventional
Estimated Equity
$456,363
Purchase Details
Closed on
Oct 26, 2022
Sold by
Puskas Ronald and Puskas Elmer
Bought by
Tristate Development Group Llc
Home Financials for this Owner
Home Financials are based on the most recent Mortgage that was taken out on this home.
Original Mortgage
$340,000
Interest Rate
6.32%
Mortgage Type
Stand Alone First
Create a Home Valuation Report for This Property
The Home Valuation Report is an in-depth analysis detailing your home's value as well as a comparison with similar homes in the area
Home Values in the Area
Average Home Value in this Area
Purchase History
| Date | Buyer | Sale Price | Title Company |
|---|---|---|---|
| Mallick Tushar | $1,410,100 | First American Title | |
| Tristate Development Group Llc | $297,000 | Stewart Title Insurance Co | |
| Tristate Development Group Llc | $297,000 | Stewart Title Insurance Co | |
| Tristate Development Group Llc | $297,000 | Stewart Title Insurance Co | |
| Tristate Development Group Llc | $297,000 | Stewart Title Insurance Co |
Source: Public Records
Mortgage History
| Date | Status | Borrower | Loan Amount |
|---|---|---|---|
| Open | Mallick Tushar | $916,500 | |
| Previous Owner | Tristate Development Group Llc | $270,000 | |
| Previous Owner | Tristate Development Group Llc | $340,000 |
Source: Public Records
Tax History
| Year | Tax Paid | Tax Assessment Tax Assessment Total Assessment is a certain percentage of the fair market value that is determined by local assessors to be the total taxable value of land and additions on the property. | Land | Improvement |
|---|---|---|---|---|
| 2025 | $17,022 | $515 | $277 | $238 |
| 2024 | $62,620 | $515 | $277 | $238 |
| 2023 | $17,032 | $515 | $277 | $238 |
| 2022 | $17,032 | $515 | $277 | $238 |
| 2021 | $27,888 | $491 | $264 | $227 |
| 2020 | $19,139 | $878 | $611 | $267 |
| 2019 | $22,021 | $878 | $611 | $267 |
| 2018 | $17,781 | $878 | $0 | $0 |
| 2017 | $11,562 | $878 | $611 | $267 |
| 2016 | $16,237 | $878 | $611 | $267 |
| 2015 | $5,771 | $878 | $611 | $267 |
| 2014 | $5,771 | $878 | $611 | $267 |
| 2013 | $4,401 | $878 | $611 | $267 |
Source: Public Records
Map
Nearby Homes
Your Personal Tour Guide
Ask me questions while you tour the home.