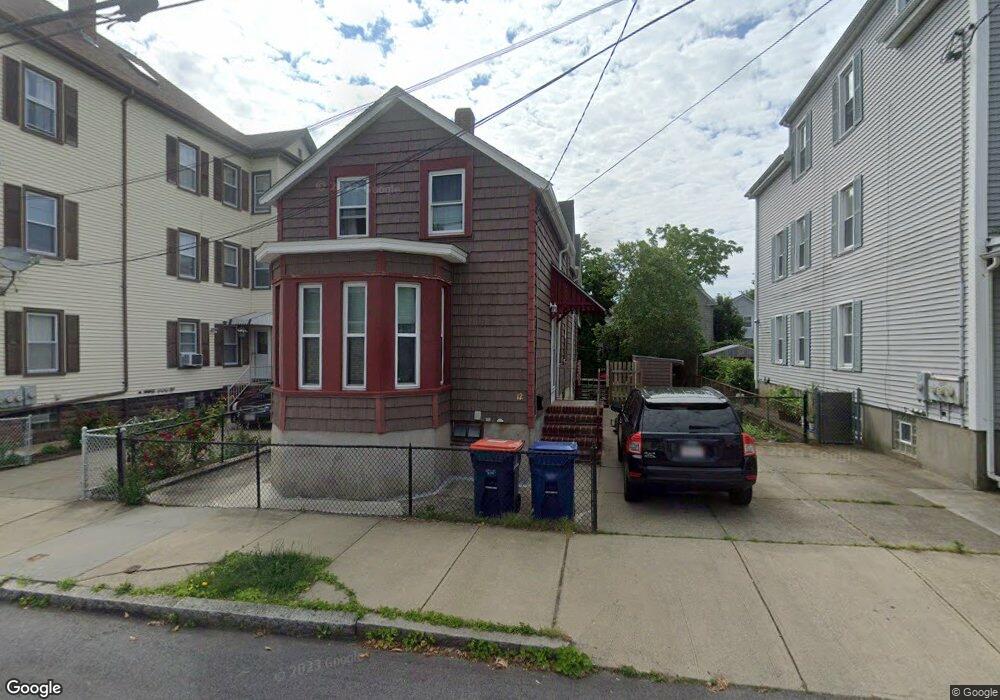
12 Clay St New Bedford, MA 02740
The South End NeighborhoodEstimated Value: $343,000 - $386,000
3
Beds
2
Baths
1,189
Sq Ft
$307/Sq Ft
Est. Value
About This Home
This home is located at 12 Clay St, New Bedford, MA 02740 and is currently estimated at $364,985, approximately $306 per square foot. 12 Clay St is a home located in Bristol County with nearby schools including James B. Congdon Elementary, Roosevelt Middle School, and New Bedford High School.
Ownership History
Date
Name
Owned For
Owner Type
Purchase Details
Closed on
Oct 6, 2021
Sold by
Bettencourt Laurie K
Bought by
Bettencourt Matthew A
Current Estimated Value
Purchase Details
Closed on
Jul 29, 1996
Sold by
Donaghy Daniel P and Donaghy Linda M
Bought by
Bettencourt Kevin A and Bettencourt Laurie K
Create a Home Valuation Report for This Property
The Home Valuation Report is an in-depth analysis detailing your home's value as well as a comparison with similar homes in the area
Home Values in the Area
Average Home Value in this Area
Purchase History
| Date | Buyer | Sale Price | Title Company |
|---|---|---|---|
| Bettencourt Matthew A | -- | None Available | |
| Bettencourt Matthew A | -- | None Available | |
| Bettencourt Kevin A | $78,000 | -- | |
| Bettencourt Kevin A | $78,000 | -- |
Source: Public Records
Mortgage History
| Date | Status | Borrower | Loan Amount |
|---|---|---|---|
| Previous Owner | Bettencourt Kevin A | $113,000 | |
| Previous Owner | Bettencourt Kevin A | $13,500 | |
| Previous Owner | Bettencourt Kevin A | $120,000 |
Source: Public Records
Tax History Compared to Growth
Tax History
| Year | Tax Paid | Tax Assessment Tax Assessment Total Assessment is a certain percentage of the fair market value that is determined by local assessors to be the total taxable value of land and additions on the property. | Land | Improvement |
|---|---|---|---|---|
| 2025 | $3,306 | $292,300 | $93,500 | $198,800 |
| 2024 | $3,112 | $259,300 | $90,200 | $169,100 |
| 2023 | $3,145 | $220,100 | $75,500 | $144,600 |
| 2022 | $2,780 | $187,600 | $73,500 | $114,100 |
| 2021 | $2,780 | $178,300 | $70,100 | $108,200 |
| 2020 | $2,765 | $171,100 | $70,100 | $101,000 |
| 2019 | $2,722 | $165,300 | $70,100 | $95,200 |
| 2018 | $7,984 | $154,400 | $70,100 | $84,300 |
| 2017 | $2,450 | $146,800 | $71,800 | $75,000 |
| 2016 | $2,333 | $141,500 | $71,800 | $69,700 |
| 2015 | $2,152 | $136,800 | $71,800 | $65,000 |
| 2014 | $2,015 | $132,900 | $71,800 | $61,100 |
Source: Public Records
Map
Nearby Homes