Estimated Value: $371,000 - $487,000
3
Beds
2
Baths
1,632
Sq Ft
$246/Sq Ft
Est. Value
About This Home
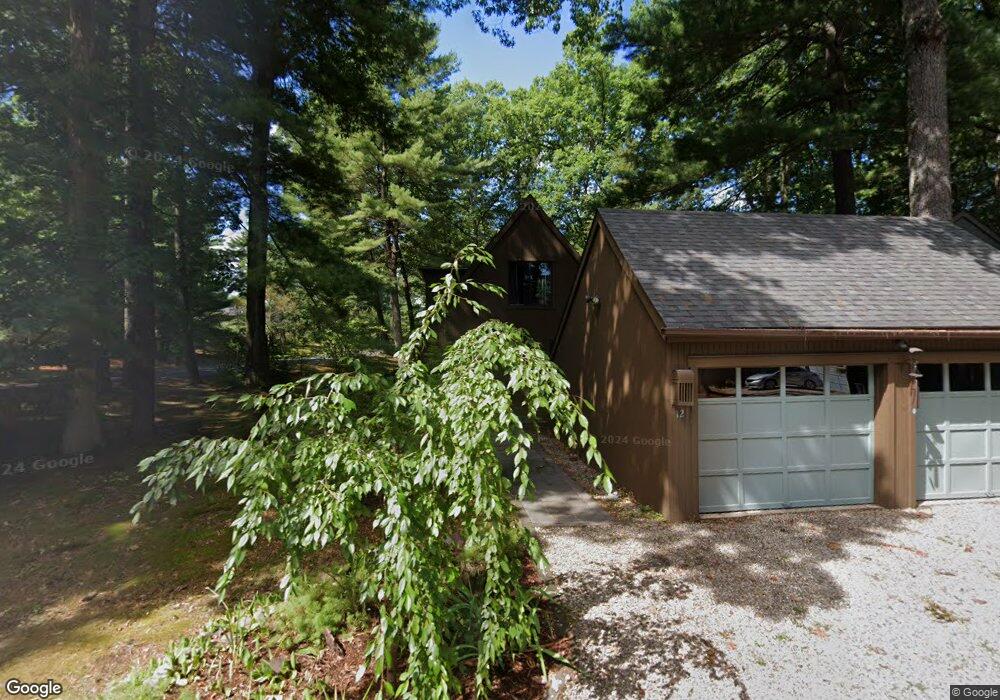
This home is located at 12 Clover Ct, Avon, CT 06001 and is currently estimated at $401,253, approximately $245 per square foot. 12 Clover Ct is a home located in Hartford County with nearby schools including Thompson Brook School, Pine Grove School, and Avon Middle School.
Ownership History
Date
Name
Owned For
Owner Type
Purchase Details
Closed on
Jan 11, 2013
Sold by
Shah Palak P and Shah Pratik B
Bought by
Osadchey Sherry L
Current Estimated Value
Home Financials for this Owner
Home Financials are based on the most recent Mortgage that was taken out on this home.
Original Mortgage
$144,000
Outstanding Balance
$100,524
Interest Rate
3.38%
Mortgage Type
Stand Alone Refi Refinance Of Original Loan
Estimated Equity
$300,729
Purchase Details
Closed on
Mar 31, 2008
Sold by
Oursler Marlanne
Bought by
Shah Palak P and Shah Pratik B
Purchase Details
Closed on
Jun 16, 2004
Sold by
Hazard Jeffrey M and Hazard Kristin
Bought by
Oursler Marianne
Purchase Details
Closed on
Sep 3, 1996
Sold by
Harris Jeffrey
Bought by
Hazard Jeffrey
Create a Home Valuation Report for This Property
The Home Valuation Report is an in-depth analysis detailing your home's value as well as a comparison with similar homes in the area
Home Values in the Area
Average Home Value in this Area
Purchase History
| Date | Buyer | Sale Price | Title Company |
|---|---|---|---|
| Osadchey Sherry L | $180,000 | -- | |
| Osadchey Sherry L | $180,000 | -- | |
| Shah Palak P | $232,500 | -- | |
| Shah Palak P | $232,500 | -- | |
| Oursler Marianne | $202,000 | -- | |
| Oursler Marianne | $202,000 | -- | |
| Hazard Jeffrey | $131,000 | -- | |
| Hazard Jeffrey | $131,000 | -- |
Source: Public Records
Mortgage History
| Date | Status | Borrower | Loan Amount |
|---|---|---|---|
| Open | Hazard Jeffrey | $10,000 | |
| Open | Osadchey Sherry L | $144,000 | |
| Closed | Osadchey Sherry L | $144,000 |
Source: Public Records
Tax History
| Year | Tax Paid | Tax Assessment Tax Assessment Total Assessment is a certain percentage of the fair market value that is determined by local assessors to be the total taxable value of land and additions on the property. | Land | Improvement |
|---|---|---|---|---|
| 2025 | $6,187 | $201,210 | $0 | $201,210 |
| 2024 | $5,968 | $201,210 | $0 | $201,210 |
| 2023 | $5,075 | $143,390 | $0 | $143,390 |
| 2022 | $4,963 | $143,390 | $0 | $143,390 |
| 2021 | $4,905 | $143,390 | $0 | $143,390 |
| 2020 | $4,718 | $143,390 | $0 | $143,390 |
| 2019 | $4,718 | $143,390 | $0 | $143,390 |
| 2018 | $4,495 | $143,390 | $0 | $143,390 |
| 2017 | $4,386 | $143,390 | $0 | $143,390 |
| 2016 | $4,233 | $143,390 | $0 | $143,390 |
| 2015 | $4,130 | $143,390 | $0 | $143,390 |
| 2014 | $4,061 | $143,390 | $0 | $143,390 |
Source: Public Records
Map
Nearby Homes
- 7 Owl Ct Unit 7
- 95 Moravia Rd
- 19 Jackson St
- 120 Climax Rd
- 187 W Avon Rd
- 51 Hendricks Ln
- 7 Woodmont Rd
- 239 Old Farms Rd Unit 7C
- 239 Old Farms Rd Unit 15C
- 125 Country Club Rd
- 27 Fernwood Dr
- 30 Cliff Dr
- 370A W Mountain Rd
- 26 Forest Ln
- 189 W Avon Rd
- 185 W Avon Rd
- 100 Nod Way
- 102 Cold Spring Rd
- 5 Abbottsford Unit 5
- 7 Shaw Dr
Your Personal Tour Guide
Ask me questions while you tour the home.