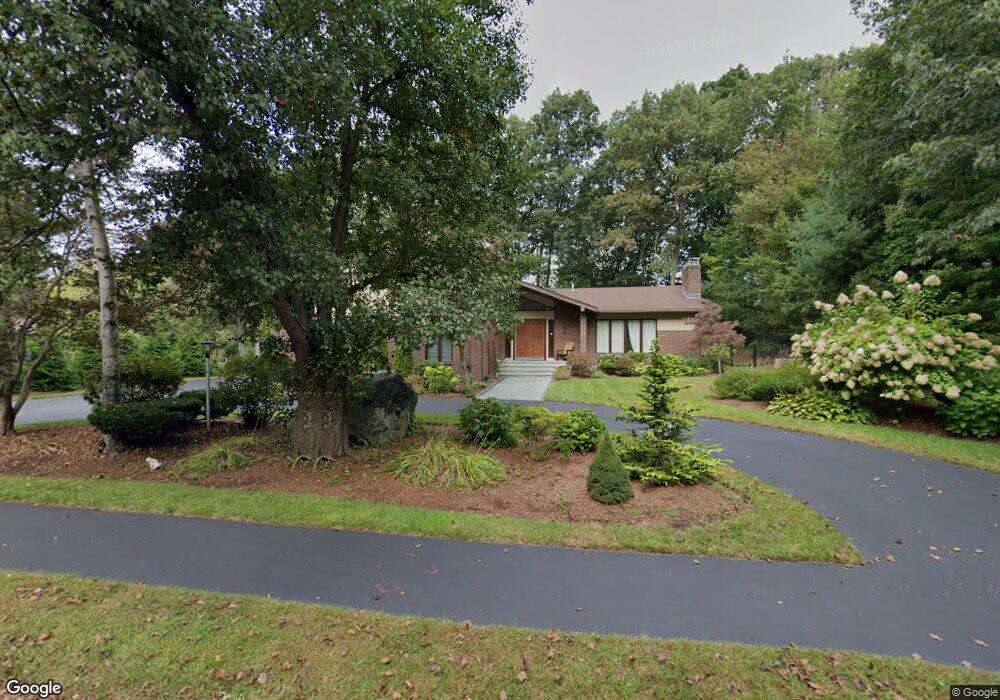
12 Coolidge Rd Winchester, MA 01890
West Side NeighborhoodEstimated Value: $1,888,000 - $2,111,000
5
Beds
4
Baths
3,974
Sq Ft
$500/Sq Ft
Est. Value
About This Home
This home is located at 12 Coolidge Rd, Winchester, MA 01890 and is currently estimated at $1,988,105, approximately $500 per square foot. 12 Coolidge Rd is a home located in Middlesex County with nearby schools including Vinson-Owen Elementary School, McCall Middle School, and Winchester High School.
Ownership History
Date
Name
Owned For
Owner Type
Purchase Details
Closed on
Nov 8, 2013
Sold by
Celli Enrico R and Celli Carla
Bought by
Athanasiou Christos P and Athanasiou Stefania A
Current Estimated Value
Home Financials for this Owner
Home Financials are based on the most recent Mortgage that was taken out on this home.
Original Mortgage
$675,000
Outstanding Balance
$477,830
Interest Rate
3%
Mortgage Type
Adjustable Rate Mortgage/ARM
Estimated Equity
$1,510,275
Create a Home Valuation Report for This Property
The Home Valuation Report is an in-depth analysis detailing your home's value as well as a comparison with similar homes in the area
Home Values in the Area
Average Home Value in this Area
Purchase History
| Date | Buyer | Sale Price | Title Company |
|---|---|---|---|
| Athanasiou Christos P | $900,000 | -- | |
| Celli Enrico R | -- | -- | |
| Athanasiou Christos P | $900,000 | -- | |
| Celli Enrico R | -- | -- |
Source: Public Records
Mortgage History
| Date | Status | Borrower | Loan Amount |
|---|---|---|---|
| Open | Celli Enrico R | $675,000 | |
| Closed | Celli Enrico R | $675,000 |
Source: Public Records
Tax History Compared to Growth
Tax History
| Year | Tax Paid | Tax Assessment Tax Assessment Total Assessment is a certain percentage of the fair market value that is determined by local assessors to be the total taxable value of land and additions on the property. | Land | Improvement |
|---|---|---|---|---|
| 2025 | $187 | $1,684,700 | $1,002,200 | $682,500 |
| 2024 | $17,879 | $1,578,000 | $922,200 | $655,800 |
| 2023 | $15,813 | $1,340,100 | $762,200 | $577,900 |
| 2022 | $16,197 | $1,294,700 | $702,000 | $592,700 |
| 2021 | $5,356 | $1,194,700 | $602,000 | $592,700 |
| 2020 | $5,145 | $1,194,700 | $602,000 | $592,700 |
| 2019 | $13,983 | $1,154,700 | $562,000 | $592,700 |
| 2018 | $4,855 | $1,109,700 | $517,000 | $592,700 |
| 2017 | $4,765 | $1,033,000 | $517,000 | $516,000 |
| 2016 | $11,434 | $978,900 | $517,000 | $461,900 |
| 2015 | $10,688 | $880,400 | $451,000 | $429,400 |
| 2014 | $10,783 | $851,700 | $432,000 | $419,700 |
Source: Public Records
Map
Nearby Homes
- 189 High St
- 19 Cox Rd
- 20 Amberwood Dr
- 139 High St
- 257 High St
- 7 Thornberry Rd
- 26 Berkshire Dr
- 41 Squire Rd
- 276 High St
- 16 Ridge St
- 19 Gershon Way Unit 1
- 19 Gershon Way
- 30 Whipple Rd
- 7 Wainwright Rd Unit 118
- 7 Grace Rd
- 16 Winning Farm Rd Unit 16
- 273 Cambridge Rd Unit 202
- 89 Wildwood St
- 21 Derby Dr Unit 21
- 281 Forest St