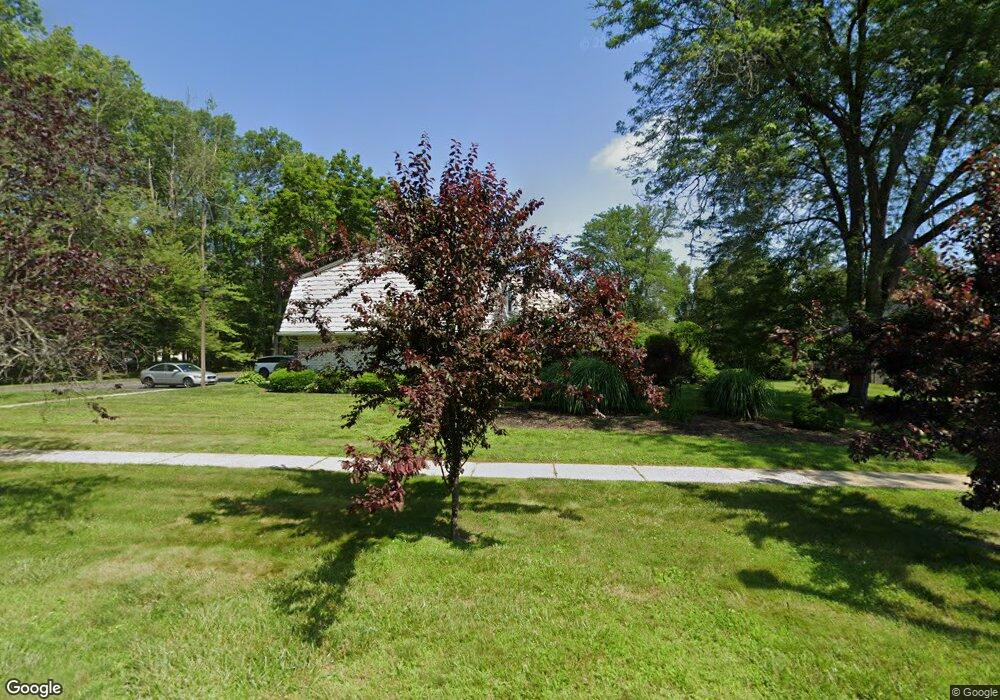
12 Corey Colonial Agawam, MA 01001
Estimated Value: $246,000 - $310,000
2
Beds
2
Baths
1,500
Sq Ft
$177/Sq Ft
Est. Value
About This Home
This home is located at 12 Corey Colonial, Agawam, MA 01001 and is currently estimated at $265,288, approximately $176 per square foot. 12 Corey Colonial is a home located in Hampden County with nearby schools including Agawam Junior High School, Agawam High School, and St Thomas The Apostle School.
Ownership History
Date
Name
Owned For
Owner Type
Purchase Details
Closed on
Jul 10, 2024
Sold by
Mika James J and Mika Tina V
Bought by
Mika
Current Estimated Value
Purchase Details
Closed on
Jun 14, 2010
Sold by
Mika Tina V and Mitchell Tina V
Bought by
Mika Tina V and Mika James J
Home Financials for this Owner
Home Financials are based on the most recent Mortgage that was taken out on this home.
Original Mortgage
$40,000
Interest Rate
5.11%
Mortgage Type
Purchase Money Mortgage
Purchase Details
Closed on
Oct 10, 1996
Sold by
Nochimson Michael P
Bought by
Mitchell Tina
Home Financials for this Owner
Home Financials are based on the most recent Mortgage that was taken out on this home.
Original Mortgage
$38,000
Interest Rate
8.06%
Mortgage Type
Purchase Money Mortgage
Purchase Details
Closed on
Jul 31, 1992
Sold by
Korb Daniel J and Korb Margaret D
Bought by
Nochimson Michael P
Create a Home Valuation Report for This Property
The Home Valuation Report is an in-depth analysis detailing your home's value as well as a comparison with similar homes in the area
Home Values in the Area
Average Home Value in this Area
Purchase History
| Date | Buyer | Sale Price | Title Company |
|---|---|---|---|
| Mika | -- | None Available | |
| Mika | -- | None Available | |
| Mika Tina V | -- | -- | |
| Mika Tina V | -- | -- | |
| Mika Tina | -- | -- | |
| Mitchell Tina | $70,000 | -- | |
| Mitchell Tina V | $70,000 | -- | |
| Nochimson Michael P | $73,500 | -- | |
| Nochimson Michael P | $73,500 | -- |
Source: Public Records
Mortgage History
| Date | Status | Borrower | Loan Amount |
|---|---|---|---|
| Previous Owner | Mika Tina | $40,000 | |
| Previous Owner | Nochimson Michael P | $38,000 |
Source: Public Records
Tax History Compared to Growth
Tax History
| Year | Tax Paid | Tax Assessment Tax Assessment Total Assessment is a certain percentage of the fair market value that is determined by local assessors to be the total taxable value of land and additions on the property. | Land | Improvement |
|---|---|---|---|---|
| 2025 | $2,937 | $200,600 | $0 | $200,600 |
| 2024 | $2,917 | $200,600 | $0 | $200,600 |
| 2023 | $2,365 | $149,900 | $0 | $149,900 |
| 2022 | $2,289 | $142,100 | $0 | $142,100 |
| 2021 | $2,286 | $136,100 | $0 | $136,100 |
| 2020 | $2,259 | $134,200 | $0 | $134,200 |
| 2019 | $2,203 | $132,300 | $0 | $132,300 |
| 2018 | $2,048 | $123,300 | $0 | $123,300 |
| 2017 | $2,004 | $122,900 | $0 | $122,900 |
| 2016 | $1,914 | $118,300 | $0 | $118,300 |
| 2015 | $1,906 | $121,100 | $0 | $121,100 |
Source: Public Records
Map
Nearby Homes
- 37 Corey Colonial
- 172 Beekman Dr Unit 172
- 174 Beekman Dr Unit 174
- 72 Plantation Dr
- 28 Meadow Ave
- 198 Beekman Dr
- 18 Wildflower Ln
- 420 Main St Unit 82
- 83 Harvey Johnson Dr
- 51 Merrell Dr
- 795 Main St
- 124 Regency Park Dr
- 60 Alhambra Cir S
- 23 Peros Dr
- 52 Peros Dr
- 68 Peros Dr
- 35 Birch Hill Rd
- 64 Woodside Dr
- 4H Mapleviewlane Unit 4H
- 0 Silver St
- 9 Corey Colonial
- 16 Corey Colonial
- 15 Corey Colonial
- 14 Corey Colonial
- 13 Corey Colonial
- 11 Corey Colonial
- 10 Corey Colonial
- 48 Corey Colonial
- 47 Corey Colonial
- 46 Corey Colonial
- 45 Corey Colonial
- 44 Corey Colonial
- 43 Corey Colonial
- 42 Corey Colonial
- 41 Corey Colonial
- 24 Corey Colonial
- 23 Corey Colonial
- 22 Corey Colonial
- 21 Corey Colonial
- 20 Corey Colonial