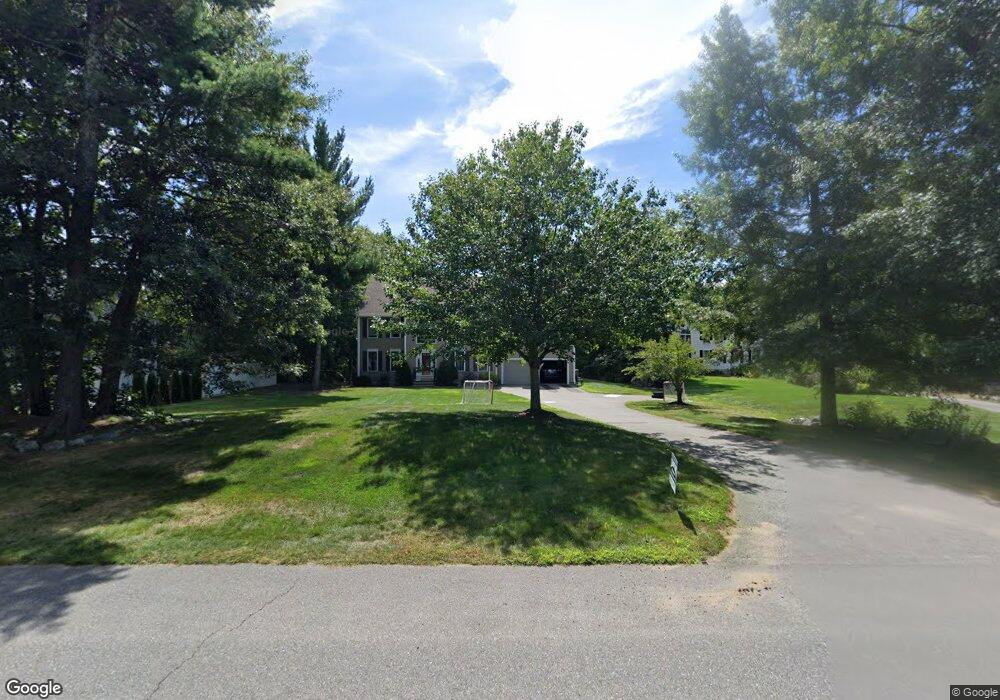
12 Corliss Rd Windham, NH 03087
Estimated Value: $813,539 - $904,000
4
Beds
3
Baths
2,452
Sq Ft
$356/Sq Ft
Est. Value
About This Home
This home is located at 12 Corliss Rd, Windham, NH 03087 and is currently estimated at $872,885, approximately $355 per square foot. 12 Corliss Rd is a home located in Rockingham County with nearby schools including Golden Brook Elementary School, Windham Middle School, and Windham High School.
Ownership History
Date
Name
Owned For
Owner Type
Purchase Details
Closed on
Jun 1, 2005
Sold by
Ohara John and Ohara Janet L
Bought by
Martino Andrew and Martino Jennifer
Current Estimated Value
Purchase Details
Closed on
Oct 15, 2002
Sold by
Century Home Constr Ll
Bought by
Ohara John and Ohara Janet L
Purchase Details
Closed on
Apr 26, 2002
Sold by
One Line Realty Dev Ll
Bought by
Century Home Const Llc
Create a Home Valuation Report for This Property
The Home Valuation Report is an in-depth analysis detailing your home's value as well as a comparison with similar homes in the area
Home Values in the Area
Average Home Value in this Area
Purchase History
| Date | Buyer | Sale Price | Title Company |
|---|---|---|---|
| Martino Andrew | $474,900 | -- | |
| Ohara John | $379,900 | -- | |
| Century Home Const Llc | $114,000 | -- |
Source: Public Records
Mortgage History
| Date | Status | Borrower | Loan Amount |
|---|---|---|---|
| Open | Century Home Const Llc | $50,000 | |
| Open | Century Home Const Llc | $279,000 | |
| Closed | Century Home Const Llc | $275,000 |
Source: Public Records
Tax History
| Year | Tax Paid | Tax Assessment Tax Assessment Total Assessment is a certain percentage of the fair market value that is determined by local assessors to be the total taxable value of land and additions on the property. | Land | Improvement |
|---|---|---|---|---|
| 2025 | $11,821 | $835,400 | $297,200 | $538,200 |
| 2024 | $11,445 | $505,500 | $185,800 | $319,700 |
| 2023 | $10,818 | $505,500 | $185,800 | $319,700 |
| 2022 | $9,989 | $505,500 | $185,800 | $319,700 |
| 2021 | $9,405 | $505,100 | $185,800 | $319,300 |
| 2020 | $9,663 | $505,100 | $185,800 | $319,300 |
| 2019 | $8,783 | $389,500 | $156,900 | $232,600 |
| 2018 | $9,071 | $389,500 | $156,900 | $232,600 |
| 2017 | $7,868 | $389,500 | $156,900 | $232,600 |
| 2016 | $8,499 | $389,500 | $156,900 | $232,600 |
| 2015 | $8,460 | $389,500 | $156,900 | $232,600 |
| 2014 | $8,736 | $364,000 | $151,000 | $213,000 |
| 2013 | $8,640 | $366,100 | $151,000 | $215,100 |
Source: Public Records
Map
Nearby Homes
Your Personal Tour Guide
Ask me questions while you tour the home.