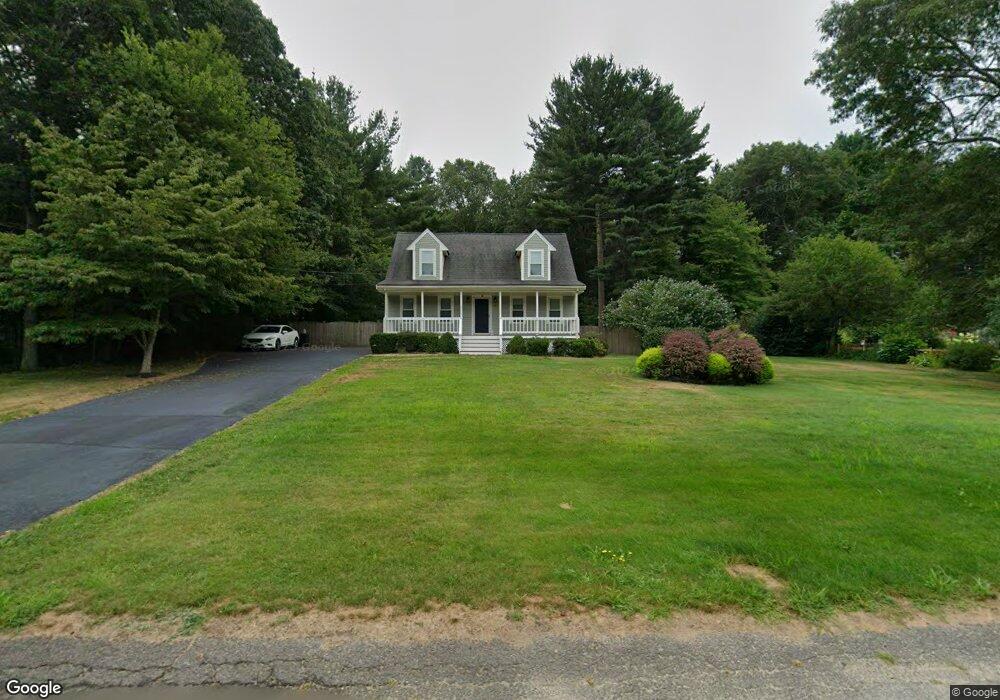
12 Crabapple Dr Berkley, MA 02779
Estimated Value: $520,549 - $782,000
2
Beds
2
Baths
1,496
Sq Ft
$416/Sq Ft
Est. Value
About This Home
This home is located at 12 Crabapple Dr, Berkley, MA 02779 and is currently estimated at $622,387, approximately $416 per square foot. 12 Crabapple Dr is a home located in Bristol County with nearby schools including Berkley Community School.
Ownership History
Date
Name
Owned For
Owner Type
Purchase Details
Closed on
Oct 26, 2001
Sold by
Muir Peter W and Muir Suzanne
Bought by
Bottiglieri Theresa L and Valley Alan
Current Estimated Value
Home Financials for this Owner
Home Financials are based on the most recent Mortgage that was taken out on this home.
Original Mortgage
$199,900
Interest Rate
6.86%
Mortgage Type
Purchase Money Mortgage
Purchase Details
Closed on
Jan 28, 1994
Sold by
Mdj Constr & Inv
Bought by
Muir Peter W and Muir Suzanne E
Create a Home Valuation Report for This Property
The Home Valuation Report is an in-depth analysis detailing your home's value as well as a comparison with similar homes in the area
Purchase History
| Date | Buyer | Sale Price | Title Company |
|---|---|---|---|
| Bottiglieri Theresa L | $249,900 | -- | |
| Muir Peter W | $138,200 | -- |
Source: Public Records
Mortgage History
| Date | Status | Borrower | Loan Amount |
|---|---|---|---|
| Open | Muir Peter W | $185,000 | |
| Closed | Muir Peter W | $199,900 | |
| Previous Owner | Muir Peter W | $118,000 | |
| Previous Owner | Muir Peter W | $26,900 |
Source: Public Records
Tax History
| Year | Tax Paid | Tax Assessment Tax Assessment Total Assessment is a certain percentage of the fair market value that is determined by local assessors to be the total taxable value of land and additions on the property. | Land | Improvement |
|---|---|---|---|---|
| 2025 | $51 | $427,400 | $145,300 | $282,100 |
| 2024 | $4,939 | $396,700 | $125,100 | $271,600 |
| 2023 | $4,780 | $361,600 | $125,100 | $236,500 |
| 2022 | $4,635 | $337,100 | $108,800 | $228,300 |
| 2021 | $4,512 | $316,000 | $103,600 | $212,400 |
| 2020 | $4,403 | $303,000 | $91,700 | $211,300 |
| 2019 | $4,285 | $292,700 | $91,700 | $201,000 |
| 2018 | $3,928 | $280,200 | $88,200 | $192,000 |
| 2017 | $3,855 | $269,600 | $98,800 | $170,800 |
| 2016 | $3,740 | $252,000 | $98,800 | $153,200 |
| 2015 | $3,345 | $240,500 | $98,800 | $141,700 |
| 2014 | $3,211 | $250,700 | $107,200 | $143,500 |
Source: Public Records
Map
Nearby Homes
- 1969 County St
- 220 Erin Rd
- 73 Seymour St
- 298 Wren St
- 23 Elmwood Dr
- 2 Bc Ln
- 2 Lima Ln
- LOT 2A Hudson Dr Unit 2A
- 52 Anthony St
- 0 Hart St Unit 73474079
- 10 Liberty St
- 11 Talbot Ave
- 96 Old Colony Ave Unit 264
- 600 County St
- 66 S Main St
- 1 Campbell Ct
- 96 Old Colony Ave Unit 212
- 96 Old Colony Ave Unit 222
- 96 Old Colony Ave Unit 231
- 96 Old Colony Ave Unit 215
Your Personal Tour Guide
Ask me questions while you tour the home.