12 Cranberry Ln Pembroke, MA 02359
Estimated Value: $772,000 - $879,000
4
Beds
2
Baths
2,420
Sq Ft
$338/Sq Ft
Est. Value
About This Home
This home is located at 12 Cranberry Ln, Pembroke, MA 02359 and is currently estimated at $818,610, approximately $338 per square foot. 12 Cranberry Ln is a home located in Plymouth County with nearby schools including Pembroke High School.
Ownership History
Date
Name
Owned For
Owner Type
Purchase Details
Closed on
Jun 4, 1998
Sold by
Merriam Christopher and Merriam Mary F
Bought by
Harland Brad P and Harland Colleen M
Current Estimated Value
Home Financials for this Owner
Home Financials are based on the most recent Mortgage that was taken out on this home.
Original Mortgage
$165,000
Interest Rate
7.05%
Mortgage Type
Purchase Money Mortgage
Create a Home Valuation Report for This Property
The Home Valuation Report is an in-depth analysis detailing your home's value as well as a comparison with similar homes in the area
Purchase History
| Date | Buyer | Sale Price | Title Company |
|---|---|---|---|
| Harland Brad P | $185,000 | -- |
Source: Public Records
Mortgage History
| Date | Status | Borrower | Loan Amount |
|---|---|---|---|
| Open | Harland Brad P | $65,000 | |
| Closed | Harland Brad P | $45,000 | |
| Open | Harland Brad P | $167,000 | |
| Closed | Harland Brad P | $165,000 |
Source: Public Records
Tax History
| Year | Tax Paid | Tax Assessment Tax Assessment Total Assessment is a certain percentage of the fair market value that is determined by local assessors to be the total taxable value of land and additions on the property. | Land | Improvement |
|---|---|---|---|---|
| 2025 | $8,166 | $679,400 | $307,200 | $372,200 |
| 2024 | $8,088 | $672,300 | $302,000 | $370,300 |
| 2023 | $7,713 | $606,400 | $287,200 | $319,200 |
| 2022 | $7,368 | $520,700 | $236,700 | $284,000 |
| 2021 | $7,197 | $493,600 | $221,500 | $272,100 |
| 2020 | $7,002 | $483,200 | $216,700 | $266,500 |
| 2019 | $6,214 | $425,600 | $211,400 | $214,200 |
| 2018 | $6,217 | $417,500 | $211,400 | $206,100 |
| 2017 | $5,987 | $396,500 | $196,600 | $199,900 |
| 2016 | $5,840 | $382,700 | $181,400 | $201,300 |
| 2015 | $5,511 | $373,900 | $171,400 | $202,500 |
Source: Public Records
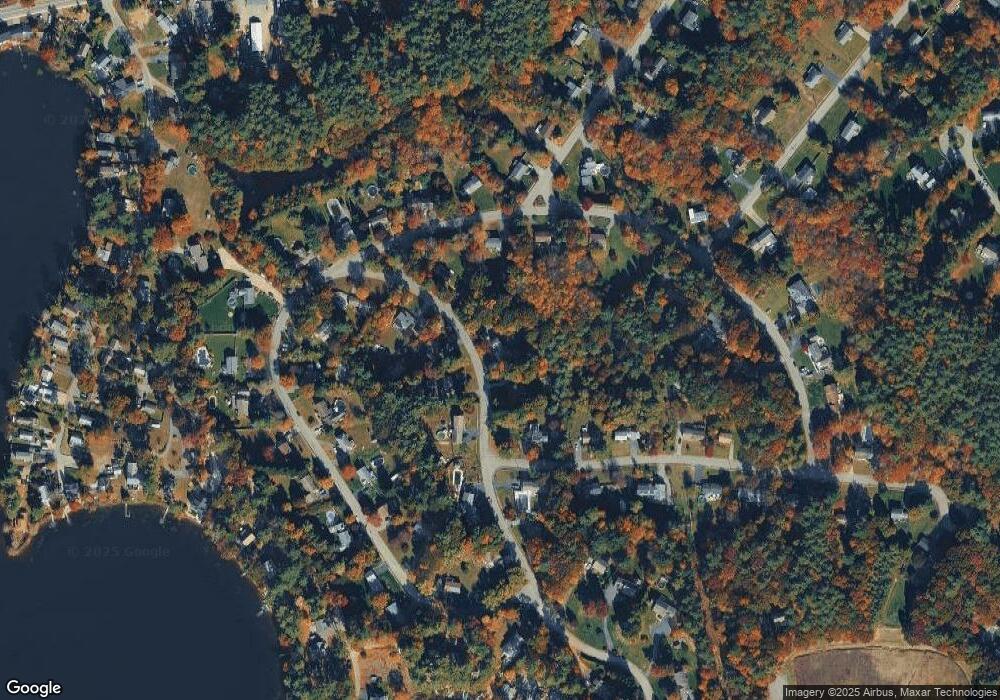
Map
Nearby Homes
- 66 Wildwood Rd
- 10 Fir Rd
- 20 Montclair Ave
- 269 Lakeside Rd
- 72 Old Cart Path Ln Unit Lot 2
- 78 Old Cart Path Ln Unit Lot 3
- 290 School St
- 77 Old Cart Path Ln Unit Lot 4
- 148 High St
- 134 Crescent St
- 353 Cross St
- 131 Elmer St
- 46 Blueberry Ln
- 118 Plain St
- 30 Old Washington St Unit 9
- 26 Jessica Cir
- 99 Old Washington St
- 318 South St
- 285 W Elm St
- 177 Dwelley St
- 18 Cranberry Ln
- 13 Cranberry Ln
- 9 Cranberry Ln
- 6 Cranberry Ln
- 2 Liane Way
- 17 Cranberry Ln
- 5 Cranberry Ln
- 10 Liane Way
- 150 Queens Brook Rd
- 1 Pond St
- 14 Liane Way
- 3 Cranberry Ln
- 5 Liane Way
- 27 Pond St
- 25 Cranberry Ln
- 194 Queens Brook Rd
- 206 Queens Brook Rd
- 149 Queens Brook Rd
- 155 Queens Brook Rd
- 178 Queens Brook Rd
Your Personal Tour Guide
Ask me questions while you tour the home.