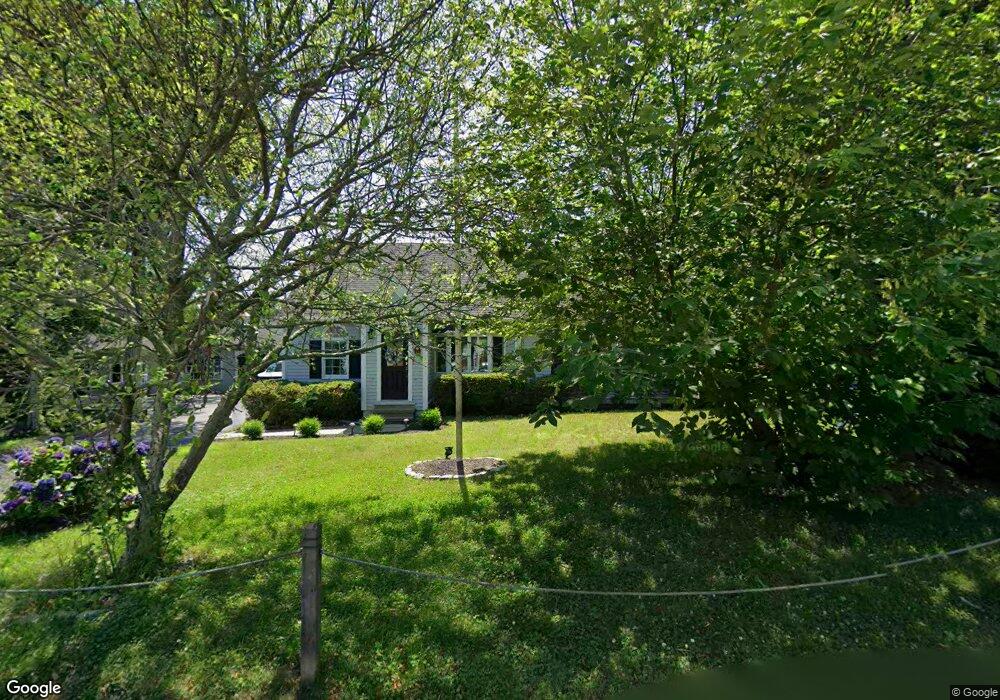
12 Crane Rd Marshfield, MA 02050
Ocean Bluff-Brant Rock NeighborhoodEstimated Value: $734,294 - $801,000
2
Beds
2
Baths
2,042
Sq Ft
$379/Sq Ft
Est. Value
About This Home
This home is located at 12 Crane Rd, Marshfield, MA 02050 and is currently estimated at $774,074, approximately $379 per square foot. 12 Crane Rd is a home located in Plymouth County with nearby schools including Daniel Webster, Furnace Brook Middle School, and Marshfield High School.
Ownership History
Date
Name
Owned For
Owner Type
Purchase Details
Closed on
Apr 15, 2022
Sold by
Smith Carl K and Smith Elaine A
Bought by
Capano Frieda and Capano Michael
Current Estimated Value
Home Financials for this Owner
Home Financials are based on the most recent Mortgage that was taken out on this home.
Original Mortgage
$400,000
Outstanding Balance
$372,363
Interest Rate
3.76%
Mortgage Type
Purchase Money Mortgage
Estimated Equity
$401,711
Create a Home Valuation Report for This Property
The Home Valuation Report is an in-depth analysis detailing your home's value as well as a comparison with similar homes in the area
Home Values in the Area
Average Home Value in this Area
Purchase History
| Date | Buyer | Sale Price | Title Company |
|---|---|---|---|
| Capano Frieda | $600,000 | None Available |
Source: Public Records
Mortgage History
| Date | Status | Borrower | Loan Amount |
|---|---|---|---|
| Open | Capano Frieda | $400,000 |
Source: Public Records
Tax History
| Year | Tax Paid | Tax Assessment Tax Assessment Total Assessment is a certain percentage of the fair market value that is determined by local assessors to be the total taxable value of land and additions on the property. | Land | Improvement |
|---|---|---|---|---|
| 2025 | $6,599 | $666,600 | $327,100 | $339,500 |
| 2024 | $6,419 | $617,800 | $306,600 | $311,200 |
| 2023 | $6,072 | $549,200 | $276,000 | $273,200 |
| 2022 | $6,072 | $468,900 | $235,100 | $233,800 |
| 2021 | $5,722 | $433,800 | $224,900 | $208,900 |
| 2020 | $5,373 | $403,100 | $194,200 | $208,900 |
| 2019 | $5,126 | $383,100 | $194,200 | $188,900 |
| 2018 | $4,994 | $373,500 | $194,200 | $179,300 |
| 2017 | $4,684 | $341,400 | $184,000 | $157,400 |
| 2016 | $4,490 | $323,500 | $173,800 | $149,700 |
| 2015 | $4,299 | $323,500 | $173,800 | $149,700 |
| 2014 | $4,177 | $314,300 | $173,800 | $140,500 |
Source: Public Records
Map
Nearby Homes
Your Personal Tour Guide
Ask me questions while you tour the home.