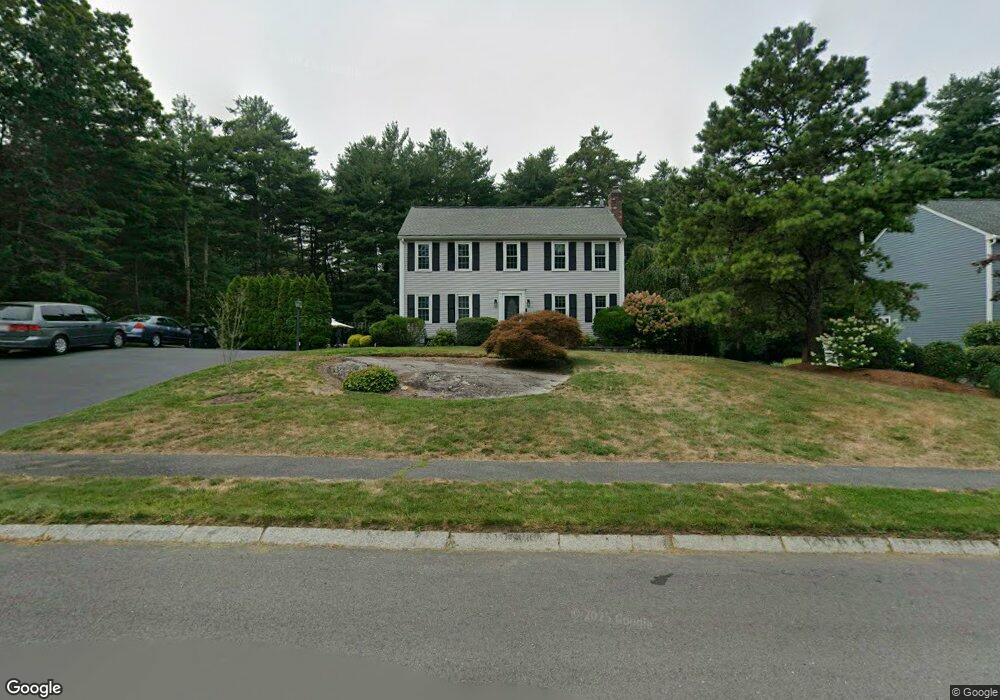
12 Crestwood Dr Norton, MA 02766
Estimated Value: $692,585 - $761,000
4
Beds
3
Baths
1,952
Sq Ft
$371/Sq Ft
Est. Value
About This Home
This home is located at 12 Crestwood Dr, Norton, MA 02766 and is currently estimated at $723,396, approximately $370 per square foot. 12 Crestwood Dr is a home located in Bristol County with nearby schools including J.C. Solmonese Elementary School, Henri A. Yelle Elementary School, and Norton Middle School.
Ownership History
Date
Name
Owned For
Owner Type
Purchase Details
Closed on
Apr 26, 2023
Sold by
Buchan Mark and Buchan Lisa A
Bought by
Buchan Lt
Current Estimated Value
Purchase Details
Closed on
Nov 26, 1997
Sold by
Dolan Christopher J and Dolan Lisa I
Bought by
Buchan Mark and Buchan Lisa A
Purchase Details
Closed on
Dec 10, 1992
Sold by
Folkman & Zola Bldrs
Bought by
Dolan Christopher and Dolan Lisa I
Create a Home Valuation Report for This Property
The Home Valuation Report is an in-depth analysis detailing your home's value as well as a comparison with similar homes in the area
Home Values in the Area
Average Home Value in this Area
Purchase History
| Date | Buyer | Sale Price | Title Company |
|---|---|---|---|
| Buchan Lt | -- | None Available | |
| Buchan Mark | $205,000 | -- | |
| Dolan Christopher | $157,000 | -- |
Source: Public Records
Mortgage History
| Date | Status | Borrower | Loan Amount |
|---|---|---|---|
| Previous Owner | Dolan Christopher | $244,000 | |
| Previous Owner | Dolan Christopher | $50,000 |
Source: Public Records
Tax History Compared to Growth
Tax History
| Year | Tax Paid | Tax Assessment Tax Assessment Total Assessment is a certain percentage of the fair market value that is determined by local assessors to be the total taxable value of land and additions on the property. | Land | Improvement |
|---|---|---|---|---|
| 2025 | $74 | $572,700 | $218,600 | $354,100 |
| 2024 | $7,119 | $549,700 | $208,100 | $341,600 |
| 2023 | $6,794 | $523,000 | $196,300 | $326,700 |
| 2022 | $6,625 | $464,600 | $178,500 | $286,100 |
| 2021 | $6,344 | $424,900 | $170,000 | $254,900 |
| 2020 | $6,151 | $415,600 | $165,000 | $250,600 |
| 2019 | $6,002 | $402,800 | $158,700 | $244,100 |
| 2018 | $5,965 | $393,500 | $158,700 | $234,800 |
| 2017 | $5,822 | $378,800 | $158,700 | $220,100 |
| 2016 | $5,648 | $361,800 | $158,700 | $203,100 |
| 2015 | $5,480 | $356,100 | $155,600 | $200,500 |
| 2014 | $5,252 | $341,700 | $148,200 | $193,500 |
Source: Public Records
Map
Nearby Homes
- 9 Larson Farm Dr
- 37 Oakleaf Dr
- 14 Country Club Way
- 451R Gilbert St
- 2 Oak St Unit 2D
- 2 Oak St Unit 2A
- 2 Oak St Unit 2C
- 2 Oak St Unit 2B
- 176 Elm St
- 4 Village Way Unit F
- 19 Precourt Ln
- 250 Mansfield Ave Unit 66
- 150 Gilbert St
- 933 Pleasant St
- 157 Mansfield Ave Unit 14
- 16 Park Ln
- 50 Kimberly Dr
- 47 Old Farm Rd
- 180 Pike Ave
- 4 Buckskin Dr
- 14 Crestwood Dr
- 8 Crestwood Dr
- 11 Crestwood Dr
- 16 Crestwood Dr
- 13 Crestwood Dr
- 9 Crestwood Dr
- 15 Crestwood Dr
- 7 Crestwood Dr
- 6 Crestwood Dr
- 18 Crestwood Dr
- 3 Autumn Ln
- 17 Crestwood Dr
- 4 Autumn Ln
- 3 Autumn Ln
- 5 Crestwood Dr
- 4 Crestwood Dr
- 3 Crestwood Dr
- 6 Stony Field Rd
- 10 Stony Field Rd
- 20 Crestwood Dr