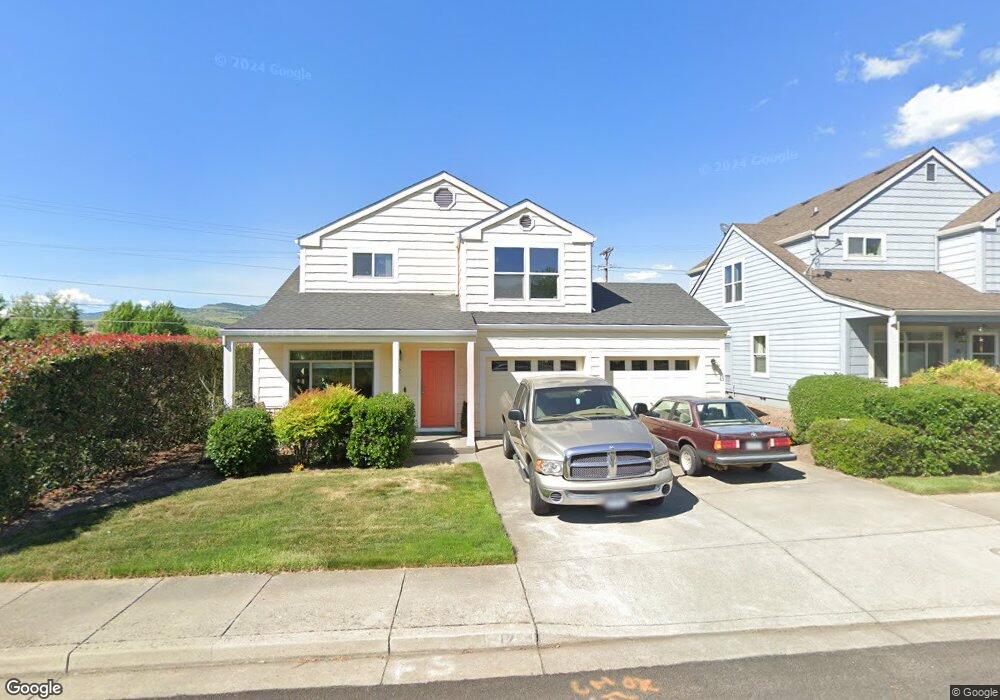
12 Crocker St Ashland, OR 97520
Croman Mill NeighborhoodEstimated Value: $401,000 - $463,814
3
Beds
3
Baths
1,657
Sq Ft
$265/Sq Ft
Est. Value
About This Home
This home is located at 12 Crocker St, Ashland, OR 97520 and is currently estimated at $438,704, approximately $264 per square foot. 12 Crocker St is a home located in Jackson County with nearby schools including Bellview Elementary School, Ashland Middle School, and Ashland High School.
Ownership History
Date
Name
Owned For
Owner Type
Purchase Details
Closed on
Mar 20, 2003
Sold by
Adams David T
Bought by
Warren Sabrina
Current Estimated Value
Purchase Details
Closed on
Jul 15, 2002
Sold by
Warren Sabrina
Bought by
Warren Sabrina and Adams David T
Home Financials for this Owner
Home Financials are based on the most recent Mortgage that was taken out on this home.
Original Mortgage
$156,560
Interest Rate
6.69%
Purchase Details
Closed on
Jul 10, 2002
Sold by
Rifkin Judith G and Rifkin Robert L
Bought by
Warren Sabrina
Home Financials for this Owner
Home Financials are based on the most recent Mortgage that was taken out on this home.
Original Mortgage
$156,560
Interest Rate
6.69%
Purchase Details
Closed on
Sep 21, 2000
Sold by
Chautauqua Trace L L C
Bought by
Rifkin Matthew H and Rifkin Robert L
Home Financials for this Owner
Home Financials are based on the most recent Mortgage that was taken out on this home.
Original Mortgage
$129,400
Interest Rate
8.07%
Create a Home Valuation Report for This Property
The Home Valuation Report is an in-depth analysis detailing your home's value as well as a comparison with similar homes in the area
Home Values in the Area
Average Home Value in this Area
Purchase History
| Date | Buyer | Sale Price | Title Company |
|---|---|---|---|
| Warren Sabrina | -- | -- | |
| Warren Sabrina | -- | First American Title Ins Co | |
| Warren Sabrina | $195,700 | First American Title Ins Co | |
| Rifkin Matthew H | $184,900 | Jackson County Title |
Source: Public Records
Mortgage History
| Date | Status | Borrower | Loan Amount |
|---|---|---|---|
| Previous Owner | Warren Sabrina | $156,560 | |
| Previous Owner | Rifkin Matthew H | $129,400 |
Source: Public Records
Tax History Compared to Growth
Tax History
| Year | Tax Paid | Tax Assessment Tax Assessment Total Assessment is a certain percentage of the fair market value that is determined by local assessors to be the total taxable value of land and additions on the property. | Land | Improvement |
|---|---|---|---|---|
| 2025 | $4,323 | $278,860 | $114,950 | $163,910 |
| 2024 | $4,323 | $270,740 | $111,600 | $159,140 |
| 2023 | $4,183 | $262,860 | $108,350 | $154,510 |
| 2022 | $4,049 | $262,860 | $108,350 | $154,510 |
| 2021 | $3,911 | $255,210 | $105,200 | $150,010 |
| 2020 | $3,801 | $247,780 | $102,140 | $145,640 |
| 2019 | $3,741 | $233,570 | $96,290 | $137,280 |
| 2018 | $3,534 | $226,770 | $93,490 | $133,280 |
| 2017 | $3,508 | $226,770 | $93,490 | $133,280 |
| 2016 | $3,417 | $213,760 | $88,120 | $125,640 |
| 2015 | $3,285 | $213,760 | $88,120 | $125,640 |
| 2014 | $3,178 | $201,500 | $83,060 | $118,440 |
Source: Public Records
Map
Nearby Homes
- 63 Crocker St
- 75 Brooks Ln
- 2275 Dollarhide Way
- 215 Tolman Creek Rd Unit SPC 10
- 233 Clay St
- 267 Meadow Dr
- 369 Meadow Dr
- 2096 Creek Dr
- 510 Washington St
- 0 Tolman Cr Rd Unit 220204970
- 582 Washington St
- 30 Knoll Crest Dr
- 700 Clay St
- 245 Majestic Ln
- 601 Washington St
- 551 Sutton Place
- 740 Park St
- 750 Park St
- 799 E Jefferson Ave
- 701 Normal Ave