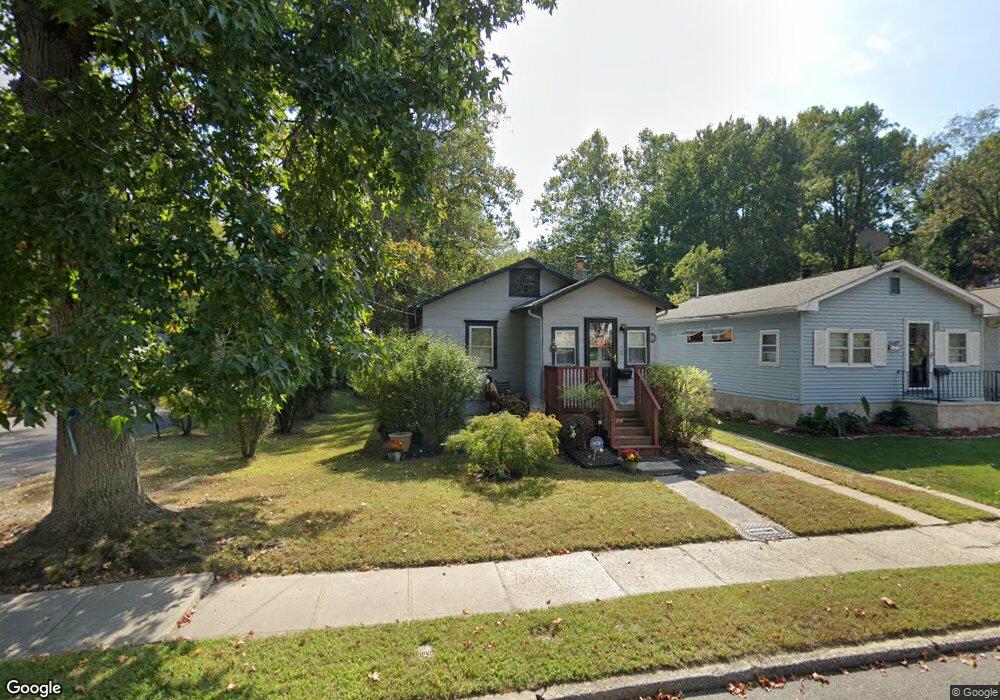
12 Cross Rd Clementon, NJ 08021
Estimated Value: $160,000 - $232,000
Studio
--
Bath
890
Sq Ft
$237/Sq Ft
Est. Value
About This Home
This home is located at 12 Cross Rd, Clementon, NJ 08021 and is currently estimated at $210,699, approximately $236 per square foot. 12 Cross Rd is a home located in Camden County with nearby schools including John Glenn Elementary School, Pine Hill Middle School, and Overbrook High School.
Ownership History
Date
Name
Owned For
Owner Type
Purchase Details
Closed on
Sep 1, 2023
Sold by
Terrell Castina D
Bought by
Terrell Tiwana
Current Estimated Value
Purchase Details
Closed on
Sep 13, 2016
Sold by
Terrell Castina D and Terell Castina D
Bought by
Terrell Castina D
Home Financials for this Owner
Home Financials are based on the most recent Mortgage that was taken out on this home.
Original Mortgage
$67,200
Interest Rate
4.02%
Mortgage Type
New Conventional
Purchase Details
Closed on
Nov 30, 2001
Sold by
Perryman Theresa
Bought by
Terell Castina
Home Financials for this Owner
Home Financials are based on the most recent Mortgage that was taken out on this home.
Original Mortgage
$54,150
Interest Rate
7.08%
Mortgage Type
FHA
Create a Home Valuation Report for This Property
The Home Valuation Report is an in-depth analysis detailing your home's value as well as a comparison with similar homes in the area
Home Values in the Area
Average Home Value in this Area
Purchase History
| Date | Buyer | Sale Price | Title Company |
|---|---|---|---|
| Terrell Tiwana | -- | None Listed On Document | |
| Terrell Tiwana | -- | None Listed On Document | |
| Terrell Castina D | -- | None Available | |
| Terell Castina | $55,000 | -- |
Source: Public Records
Mortgage History
| Date | Status | Borrower | Loan Amount |
|---|---|---|---|
| Previous Owner | Terrell Castina D | $67,200 | |
| Previous Owner | Terell Castina | $54,150 |
Source: Public Records
Tax History
| Year | Tax Paid | Tax Assessment Tax Assessment Total Assessment is a certain percentage of the fair market value that is determined by local assessors to be the total taxable value of land and additions on the property. | Land | Improvement |
|---|---|---|---|---|
| 2025 | $3,974 | $70,500 | $16,800 | $53,700 |
| 2024 | $3,837 | $70,500 | $16,800 | $53,700 |
Source: Public Records
Map
Nearby Homes
- 2704 Tall Pines
- 2702 Kenwood Dr
- 705 Mason Run
- 804 Mason Run
- 3001 Tall Pines
- 407 Mason Run
- 1102 Mason Run
- 10 Mason Ct
- 4 Mason Ct
- 200-202 Blackwood-Clementon Rd
- 26 Sherri Way
- 15 Dover Dr
- 49 Dover Dr
- 195 Chews Landing Rd
- 30 Chiswick Dr
- 1501-1521 Chews Landing Rd
- 18 Chiswick Dr Unit CU01
- 14 Carol Dr
- 29 Chiswick Dr
- 37 Chiswick Dr
Your Personal Tour Guide
Ask me questions while you tour the home.