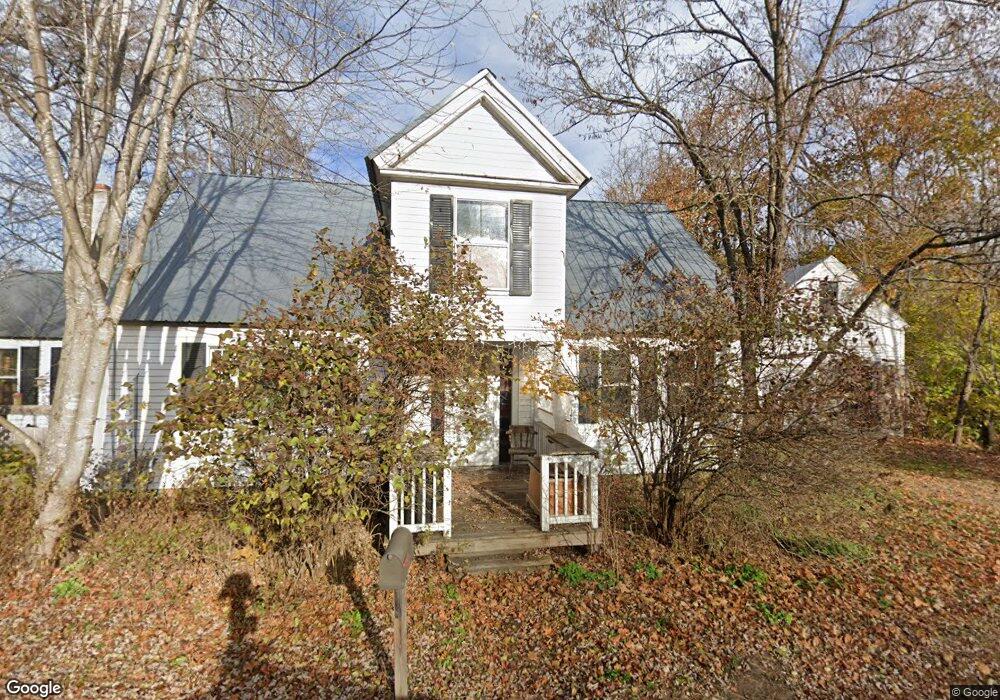
12 Cumberland St Cornish, ME 04020
Estimated Value: $325,000 - $372,000
3
Beds
1
Bath
2,045
Sq Ft
$169/Sq Ft
Est. Value
About This Home
This home is located at 12 Cumberland St, Cornish, ME 04020 and is currently estimated at $345,794, approximately $169 per square foot. 12 Cumberland St is a home located in York County.
Ownership History
Date
Name
Owned For
Owner Type
Purchase Details
Closed on
May 6, 2008
Sold by
Wells Fargo Bank Na
Bought by
Adinolfi Salvatore A
Current Estimated Value
Home Financials for this Owner
Home Financials are based on the most recent Mortgage that was taken out on this home.
Original Mortgage
$105,253
Outstanding Balance
$66,446
Interest Rate
5.99%
Mortgage Type
FHA
Estimated Equity
$279,348
Purchase Details
Closed on
Dec 21, 2007
Sold by
Bettencourt Joan L
Bought by
Wells Fargo Bank Na Tr
Create a Home Valuation Report for This Property
The Home Valuation Report is an in-depth analysis detailing your home's value as well as a comparison with similar homes in the area
Home Values in the Area
Average Home Value in this Area
Purchase History
| Date | Buyer | Sale Price | Title Company |
|---|---|---|---|
| Adinolfi Salvatore A | -- | -- | |
| Wells Fargo Bank Na Tr | -- | -- |
Source: Public Records
Mortgage History
| Date | Status | Borrower | Loan Amount |
|---|---|---|---|
| Open | Wells Fargo Bank Na Tr | $10,000 | |
| Open | Wells Fargo Bank Na Tr | $105,253 |
Source: Public Records
Tax History Compared to Growth
Tax History
| Year | Tax Paid | Tax Assessment Tax Assessment Total Assessment is a certain percentage of the fair market value that is determined by local assessors to be the total taxable value of land and additions on the property. | Land | Improvement |
|---|---|---|---|---|
| 2025 | $3,019 | $319,500 | $87,600 | $231,900 |
| 2024 | $2,692 | $292,600 | $55,800 | $236,800 |
| 2023 | $2,078 | $145,300 | $34,200 | $111,100 |
| 2022 | $2,005 | $145,300 | $34,200 | $111,100 |
| 2021 | $1,962 | $145,300 | $34,200 | $111,100 |
| 2020 | $1,947 | $145,300 | $34,200 | $111,100 |
| 2019 | $2,493 | $145,300 | $34,200 | $111,100 |
| 2018 | $1,962 | $145,300 | $34,200 | $111,100 |
| 2016 | $1,873 | $145,300 | $34,200 | $111,100 |
| 2015 | $1,874 | $145,300 | $34,200 | $111,100 |
| 2014 | $1,854 | $143,700 | $34,200 | $109,500 |
Source: Public Records
Map
Nearby Homes
- 4 Bridge St
- 20 Main St
- 22 High Rd
- 96 Maple St
- 6-13 Main St
- 696 S Hiram Rd
- Lot #3 Jordan Heights Rd
- Lot #2 Jordan Heights Rd
- Lot #8 Jordan Heights Rd
- Lot #4 Jordan Heights Rd
- Lot #11 Jordan Heights Rd
- 30 Waterfront Dr
- 992 Pequawket Trail
- 11 Marston Rd
- 266 S Hiram Rd
- Lot #5 Jordan Heights Rd
- 174 Marston Rd
- 1323 Cape Rd
- 20 Hollyhock Farm Ln
- 8 Graffam Rd