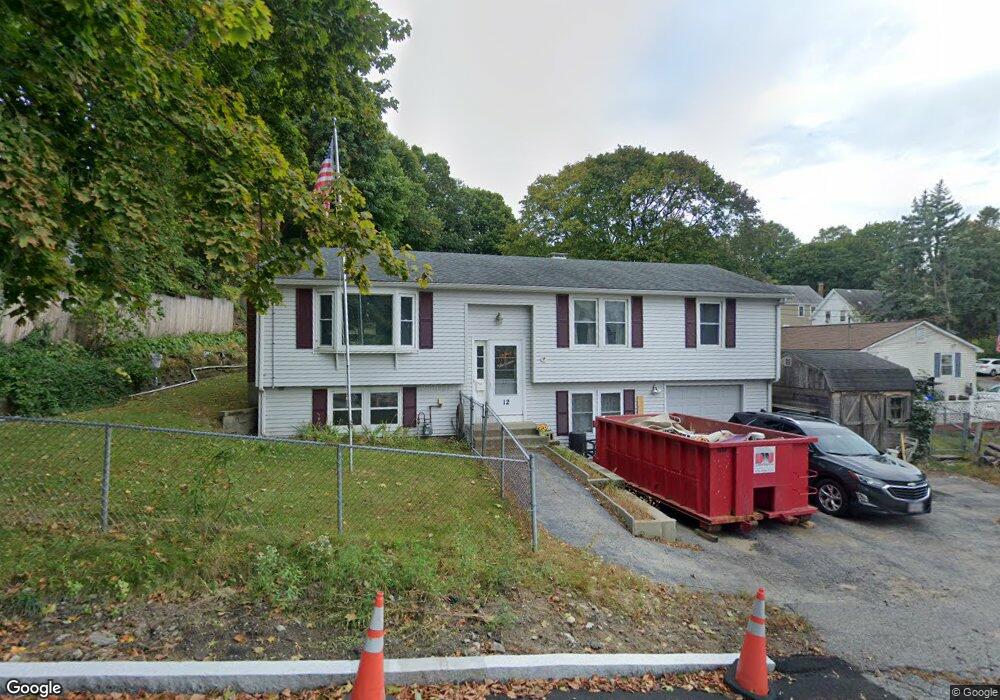
12 Dale St Unit B1 Lawrence, MA 01841
Prospect Hill-Back Bay NeighborhoodEstimated Value: $504,000 - $566,423
2
Beds
1
Bath
500
Sq Ft
$1,085/Sq Ft
Est. Value
About This Home
This home is located at 12 Dale St Unit B1, Lawrence, MA 01841 and is currently estimated at $542,356, approximately $1,084 per square foot. 12 Dale St Unit B1 is a home located in Essex County with nearby schools including Olive Branch Elementary School, James F. Hennessey School, and School For Exceptional Studies.
Ownership History
Date
Name
Owned For
Owner Type
Purchase Details
Closed on
Jul 27, 1982
Bought by
Mcdermott Cary T and Mcdermott Roberta
Current Estimated Value
Create a Home Valuation Report for This Property
The Home Valuation Report is an in-depth analysis detailing your home's value as well as a comparison with similar homes in the area
Home Values in the Area
Average Home Value in this Area
Purchase History
| Date | Buyer | Sale Price | Title Company |
|---|---|---|---|
| Mcdermott Cary T | -- | -- |
Source: Public Records
Mortgage History
| Date | Status | Borrower | Loan Amount |
|---|---|---|---|
| Open | Mcdermott Cary T | $100,000 | |
| Closed | Mcdermott Cary T | $80,000 | |
| Closed | Mcdermott Cary T | $25,000 | |
| Closed | Mcdermott Cary T | $55,000 |
Source: Public Records
Tax History Compared to Growth
Tax History
| Year | Tax Paid | Tax Assessment Tax Assessment Total Assessment is a certain percentage of the fair market value that is determined by local assessors to be the total taxable value of land and additions on the property. | Land | Improvement |
|---|---|---|---|---|
| 2025 | $4,723 | $536,700 | $163,600 | $373,100 |
| 2024 | $4,161 | $449,800 | $141,500 | $308,300 |
| 2023 | $4,703 | $462,900 | $141,500 | $321,400 |
| 2022 | $4,416 | $386,000 | $126,100 | $259,900 |
| 2021 | $4,124 | $336,100 | $126,100 | $210,000 |
| 2020 | $4,155 | $334,300 | $124,300 | $210,000 |
| 2019 | $3,830 | $280,000 | $99,300 | $180,700 |
| 2018 | $3,554 | $248,200 | $94,800 | $153,400 |
| 2017 | $3,570 | $232,700 | $87,400 | $145,300 |
| 2016 | $3,504 | $225,900 | $78,200 | $147,700 |
| 2015 | $3,180 | $210,300 | $62,600 | $147,700 |
Source: Public Records
Map
Nearby Homes
- 52 Howard St
- 19-21 Pleasant Terrace
- 7 Stevens Ct
- 80 Ferry St Unit 80A
- 262 E Haverhill St Unit 4
- 42 Union St
- 6 Brook St
- 32 Orchard St
- 65 Brook St
- 4 Shawsheen Rd Unit 2
- 106 Leroy Ave
- 89 Newbury St Unit 89B
- 68 Wesley St
- 192 Union St
- 167 Ferry 53 Mann St Unit 2,5,6
- 80 Market St
- 100-102 E Haverhill St
- 75 Beverly St Unit 75
- 35 Kendall St
- 68 Union St