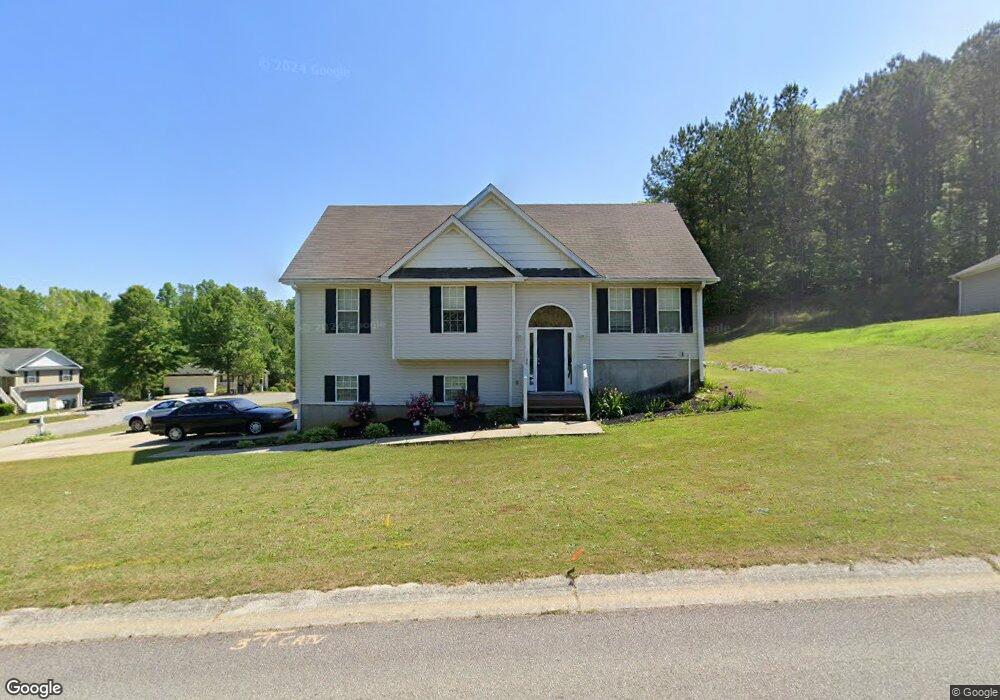
12 Darby Ct Dallas, GA 30132
East Paulding County NeighborhoodEstimated Value: $299,000 - $305,000
3
Beds
2
Baths
1,222
Sq Ft
$247/Sq Ft
Est. Value
About This Home
This home is located at 12 Darby Ct, Dallas, GA 30132 and is currently estimated at $302,165, approximately $247 per square foot. 12 Darby Ct is a home located in Paulding County with nearby schools including Northside Elementary School, Lena Mae Moses Middle School, and East Paulding High School.
Ownership History
Date
Name
Owned For
Owner Type
Purchase Details
Closed on
Sep 30, 2014
Sold by
Freo Georgia Llc
Bought by
Progress Residential 2014 1 Bo
Current Estimated Value
Purchase Details
Closed on
Jan 2, 2013
Sold by
Mimnaugh Theresa M
Bought by
Freo Georgia Llc
Purchase Details
Closed on
Mar 9, 2007
Sold by
Robinson Dale
Bought by
Mimnaugh Edward J and Mimnaugh Theresa M
Home Financials for this Owner
Home Financials are based on the most recent Mortgage that was taken out on this home.
Original Mortgage
$87,750
Interest Rate
10.05%
Mortgage Type
New Conventional
Purchase Details
Closed on
Aug 24, 2006
Sold by
Longmire Robert S and Longmire Channa M
Bought by
Robinson Dale
Purchase Details
Closed on
Oct 10, 2003
Sold by
Nar Enterprises Inc
Bought by
Longmire Robert S
Home Financials for this Owner
Home Financials are based on the most recent Mortgage that was taken out on this home.
Original Mortgage
$123,934
Interest Rate
7.63%
Mortgage Type
New Conventional
Create a Home Valuation Report for This Property
The Home Valuation Report is an in-depth analysis detailing your home's value as well as a comparison with similar homes in the area
Home Values in the Area
Average Home Value in this Area
Purchase History
| Date | Buyer | Sale Price | Title Company |
|---|---|---|---|
| Progress Residential 2014 1 Bo | -- | -- | |
| Freo Georgia Llc | $84,500 | -- | |
| Mimnaugh Edward J | $135,000 | -- | |
| Robinson Dale | $135,000 | -- | |
| Longmire Robert S | $124,000 | -- |
Source: Public Records
Mortgage History
| Date | Status | Borrower | Loan Amount |
|---|---|---|---|
| Previous Owner | Mimnaugh Edward J | $87,750 | |
| Previous Owner | Longmire Robert S | $123,934 |
Source: Public Records
Tax History Compared to Growth
Tax History
| Year | Tax Paid | Tax Assessment Tax Assessment Total Assessment is a certain percentage of the fair market value that is determined by local assessors to be the total taxable value of land and additions on the property. | Land | Improvement |
|---|---|---|---|---|
| 2024 | $2,845 | $114,360 | $12,000 | $102,360 |
| 2023 | $2,524 | $96,800 | $12,000 | $84,800 |
| 2022 | $1,710 | $65,600 | $8,000 | $57,600 |
| 2021 | $1,906 | $65,600 | $8,000 | $57,600 |
| 2020 | $1,948 | $65,600 | $8,000 | $57,600 |
| 2019 | $1,626 | $53,960 | $8,000 | $45,960 |
| 2018 | $1,414 | $46,920 | $8,000 | $38,920 |
| 2017 | $1,505 | $49,280 | $8,000 | $41,280 |
| 2016 | $1,034 | $34,200 | $8,000 | $26,200 |
| 2015 | $1,053 | $34,200 | $8,000 | $26,200 |
| 2014 | $1,067 | $34,200 | $8,000 | $26,200 |
| 2013 | -- | $22,240 | $8,000 | $14,240 |
Source: Public Records
Map
Nearby Homes
- 181 Beckett Dr
- 427 Wagon Trail Cir
- 443 Brooks Rd
- 214 River Run Dr
- 214 River Run Dr Unit 83
- 222 River Run Dr
- 222 River Run Dr Unit 82
- Brentwood Plan at Creekside Landing
- Woodbridge Plan at Creekside Landing
- Turnbridge Plan at Creekside Landing
- Reynolds Plan at Creekside Landing
- Graham Plan at Creekside Landing
- Crofton Plan at Creekside Landing
- Fairfax Plan at Creekside Landing
- Richmond Plan at Creekside Landing
- 234 River Run Dr
- 234 River Run Dr Unit 81
- 302 River Run Dr Unit 74
- 70 Stallion Run
- 16 Riders Ridge
- 268 Beckett Dr
- 32 Darby Ct
- 254 Beckett Dr
- 0 Darby Ct Unit 7163105
- 0 Darby Ct Unit 7107461
- 0 Darby Ct Unit 7226054
- 0 Darby Ct Unit 7009120
- 0 Darby Ct Unit 8843142
- 0 Darby Ct Unit 8325566
- 0 Darby Ct Unit 8155624
- 0 Darby Ct Unit 7285180
- 0 Darby Ct Unit 9063884
- 0 Darby Ct
- 316 Beckett Dr
- 0 Darby Ct Unit 7553153
- 46 Darby Ct
- 46 Darby Ct Unit 46
- 29 Darby Ct
- 29 Darby Ct Unit 45
- 253 Beckett Dr