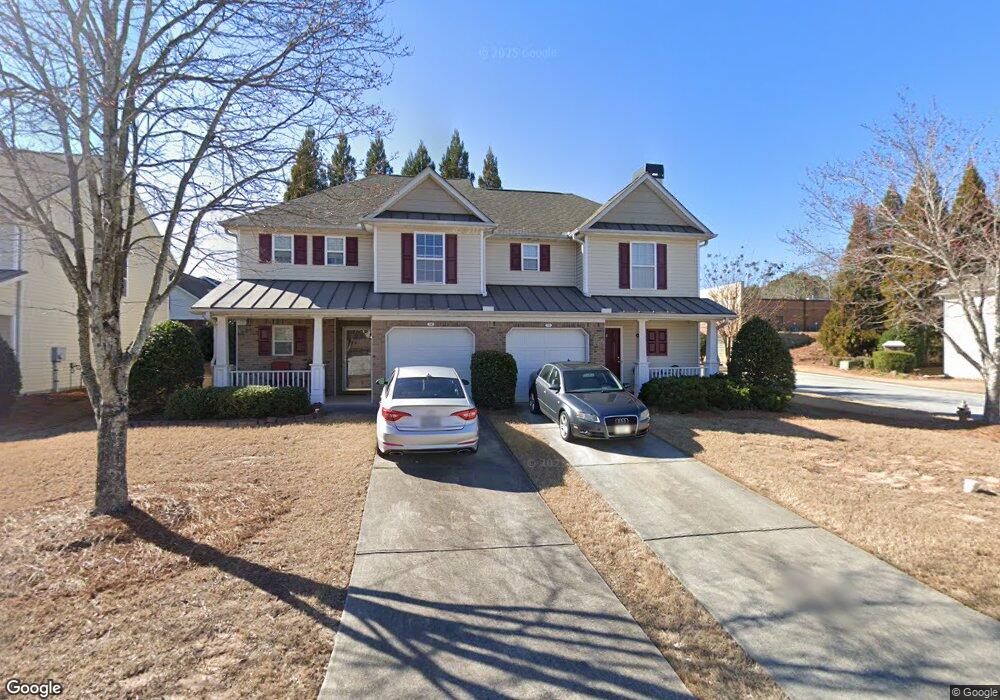
12 Darbys Crossing Ct Hiram, GA 30141
East Paulding County NeighborhoodEstimated Value: $230,805 - $244,000
2
Beds
2
Baths
1,180
Sq Ft
$201/Sq Ft
Est. Value
About This Home
This home is located at 12 Darbys Crossing Ct, Hiram, GA 30141 and is currently estimated at $237,701, approximately $201 per square foot. 12 Darbys Crossing Ct is a home located in Paulding County with nearby schools including Hiram Elementary School, P. B. Ritch Middle School, and East Paulding High School.
Ownership History
Date
Name
Owned For
Owner Type
Purchase Details
Closed on
Jul 13, 2016
Sold by
Kreiner Calille
Bought by
Munoz Phillip A
Current Estimated Value
Home Financials for this Owner
Home Financials are based on the most recent Mortgage that was taken out on this home.
Original Mortgage
$82,320
Outstanding Balance
$65,631
Interest Rate
3.54%
Mortgage Type
New Conventional
Estimated Equity
$172,070
Purchase Details
Closed on
Apr 1, 2011
Sold by
Hud-Housing Of Urban Dev
Bought by
Schulz Callie
Home Financials for this Owner
Home Financials are based on the most recent Mortgage that was taken out on this home.
Original Mortgage
$52,419
Interest Rate
5.25%
Mortgage Type
FHA
Purchase Details
Closed on
Jun 1, 2010
Sold by
Everbank
Bought by
Hud-Housing Of Urban Dev
Purchase Details
Closed on
Apr 30, 2004
Sold by
Mcbridge & Son Homes
Bought by
Davis Billy S
Home Financials for this Owner
Home Financials are based on the most recent Mortgage that was taken out on this home.
Original Mortgage
$109,998
Interest Rate
5.77%
Mortgage Type
VA
Create a Home Valuation Report for This Property
The Home Valuation Report is an in-depth analysis detailing your home's value as well as a comparison with similar homes in the area
Home Values in the Area
Average Home Value in this Area
Purchase History
| Date | Buyer | Sale Price | Title Company |
|---|---|---|---|
| Munoz Phillip A | $102,900 | -- | |
| Schulz Callie | -- | -- | |
| Hud-Housing Of Urban Dev | -- | -- | |
| Everbank | $108,208 | -- | |
| Davis Billy S | $111,800 | -- |
Source: Public Records
Mortgage History
| Date | Status | Borrower | Loan Amount |
|---|---|---|---|
| Open | Munoz Phillip A | $82,320 | |
| Previous Owner | Schulz Callie | $52,419 | |
| Previous Owner | Davis Billy S | $109,998 |
Source: Public Records
Tax History Compared to Growth
Tax History
| Year | Tax Paid | Tax Assessment Tax Assessment Total Assessment is a certain percentage of the fair market value that is determined by local assessors to be the total taxable value of land and additions on the property. | Land | Improvement |
|---|---|---|---|---|
| 2024 | $2,244 | $90,216 | $12,000 | $78,216 |
| 2023 | $2,391 | $91,712 | $12,000 | $79,712 |
| 2022 | $1,914 | $73,432 | $12,000 | $61,432 |
| 2021 | $1,550 | $53,340 | $6,000 | $47,340 |
| 2020 | $1,486 | $50,020 | $6,000 | $44,020 |
| 2019 | $1,429 | $47,424 | $6,000 | $41,424 |
| 2018 | $1,278 | $42,432 | $4,000 | $38,432 |
| 2017 | $1,184 | $38,760 | $4,000 | $34,760 |
| 2016 | $924 | $32,436 | $4,000 | $28,436 |
| 2015 | $838 | $29,068 | $4,000 | $25,068 |
| 2014 | $697 | $23,936 | $4,000 | $19,936 |
| 2013 | -- | $18,920 | $4,000 | $14,920 |
Source: Public Records
Map
Nearby Homes
- 109 Darbys Crossing Ct
- 184 Darbys Crossing Ct
- 0B Hiram Acworth Hwy
- 0C Hiram Acworth Hwy
- 80 Indian Lake Dr
- 3529 MacLand Rd
- 00 MacLand Rd
- 0 MacLand Rd Unit 10558702
- 3278 MacLand Rd
- 258 Cristy Dr
- Boylston Plan at Old Mill Preserve
- Kittridge Plan at Old Mill Preserve
- Pendula Plan at Old Mill Preserve
- Wellton Plan at Old Mill Preserve
- Anglewood Plan at Old Mill Preserve
- 507 Barnfield Way
- 517 Barnfield Way
- 1 Corley Cir
- 608 Barnfield Way
- 45 Waterloo Ct
- 12 Darbys Crossing Ct
- 14 Darbys Crossing Ct
- 24 Darbys Crossing Ct
- 106 Darby's Crossing Dr
- 11 Darbys Crossing Point
- 104 Darby's Crossing Dr
- 11 Darby's Crossing Point
- 26 Darbys Crossing Ct
- 11 Darbys Crossing Ct
- 11 Darbys Crossing Ct Unit 11
- 15 Darbys Crossing Ct
- 17 Darbys Crossing Ct
- 13 Darbys Crossing Point Unit 13
- 13 Darbys Crossing Point
- 32 Darbys Crossing Ct
- 19 Darbys Crossing Point
- 10 Darbys Crossing Point
- 21 Darbys Crossing Point Unit 71
- 21 Darbys Crossing Point
- 21 Darbys Crossing Point