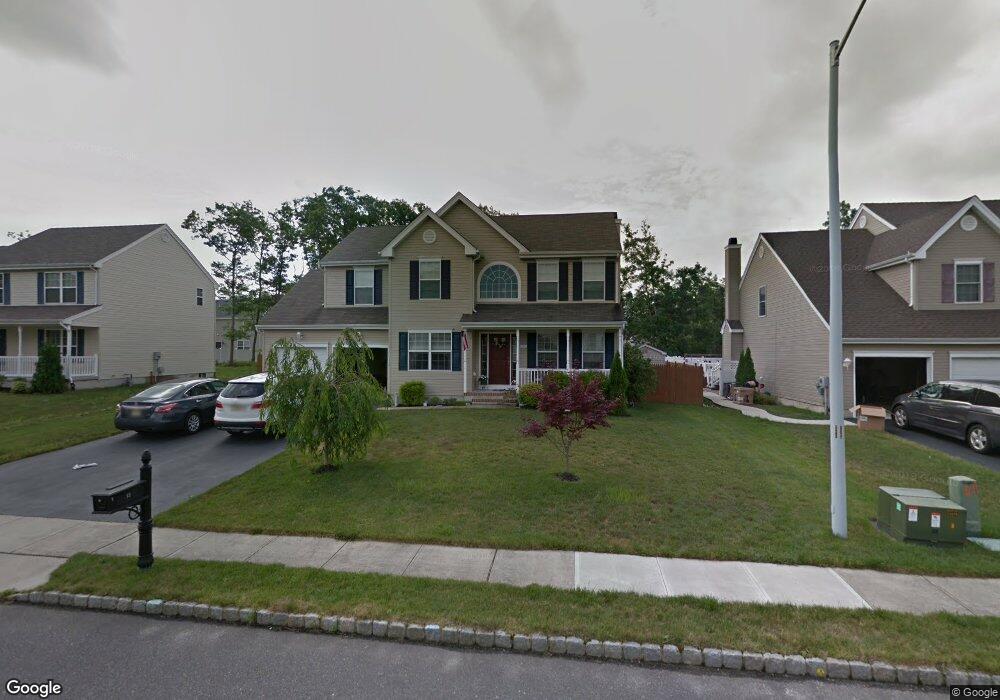
12 David Dr Barnegat, NJ 08005
Barnegat Township NeighborhoodEstimated Value: $573,547 - $666,000
4
Beds
3
Baths
3,301
Sq Ft
$191/Sq Ft
Est. Value
About This Home
This home is located at 12 David Dr, Barnegat, NJ 08005 and is currently estimated at $629,387, approximately $190 per square foot. 12 David Dr is a home located in Ocean County with nearby schools including Barnegat High School and St. Mary Academy.
Ownership History
Date
Name
Owned For
Owner Type
Purchase Details
Closed on
Jan 13, 2023
Sold by
Macinnes Craig
Bought by
Macinnes Michele K
Current Estimated Value
Purchase Details
Closed on
Nov 13, 2008
Home Financials for this Owner
Home Financials are based on the most recent Mortgage that was taken out on this home.
Original Mortgage
$288,000
Interest Rate
6.11%
Mortgage Type
Purchase Money Mortgage
Purchase Details
Closed on
Oct 22, 2004
Sold by
Mark Barclay Llc
Bought by
Walters Development Co Llc
Create a Home Valuation Report for This Property
The Home Valuation Report is an in-depth analysis detailing your home's value as well as a comparison with similar homes in the area
Home Values in the Area
Average Home Value in this Area
Purchase History
| Date | Buyer | Sale Price | Title Company |
|---|---|---|---|
| Macinnes Michele K | $127,912 | -- | |
| Macinnes Michele K | $127,912 | None Listed On Document | |
| -- | $339,800 | -- | |
| Macinnes Craig | $339,816 | Trans County Title Agency Ll | |
| Walters Development Co Llc | -- | -- |
Source: Public Records
Mortgage History
| Date | Status | Borrower | Loan Amount |
|---|---|---|---|
| Previous Owner | Macinnes Craig | $288,000 |
Source: Public Records
Tax History Compared to Growth
Tax History
| Year | Tax Paid | Tax Assessment Tax Assessment Total Assessment is a certain percentage of the fair market value that is determined by local assessors to be the total taxable value of land and additions on the property. | Land | Improvement |
|---|---|---|---|---|
| 2025 | $9,776 | $328,400 | $85,300 | $243,100 |
| 2024 | $9,560 | $328,400 | $85,300 | $243,100 |
| 2023 | $9,251 | $328,400 | $85,300 | $243,100 |
| 2022 | $9,251 | $328,400 | $85,300 | $243,100 |
| 2021 | $9,208 | $328,400 | $85,300 | $243,100 |
| 2020 | $9,166 | $328,400 | $85,300 | $243,100 |
| 2019 | $9,031 | $328,400 | $85,300 | $243,100 |
| 2018 | $8,962 | $328,400 | $85,300 | $243,100 |
| 2017 | $8,814 | $328,400 | $85,300 | $243,100 |
| 2016 | $8,634 | $328,400 | $85,300 | $243,100 |
| 2015 | $8,343 | $327,700 | $85,300 | $242,400 |
| 2014 | $8,130 | $327,700 | $85,300 | $242,400 |
Source: Public Records
Map
Nearby Homes
- 48 Farragut Ave
- 5 Minnow Ave
- 19 Fawcett Blvd
- 22 Fawcett Blvd
- 4 Plunder Ave
- 23 Fawcett Blvd
- 164 Nautilus Dr
- 7 Watts Ave
- 2 Plunder Ave
- 9 Michael Ave
- 11 Michael Ave
- Eastover Plan at Ocean Acres
- Deerfield Plan at Ocean Acres
- Galen Plan at Ocean Acres
- Northwest Plan at Ocean Acres
- 121 Trim Ln
- 126 Trim Ln
- 14 Westport Dr
- 695 Lighthouse Dr
- 653 Lighthouse Dr