Estimated Value: $798,000 - $983,944
3
Beds
4
Baths
2,437
Sq Ft
$369/Sq Ft
Est. Value
About This Home
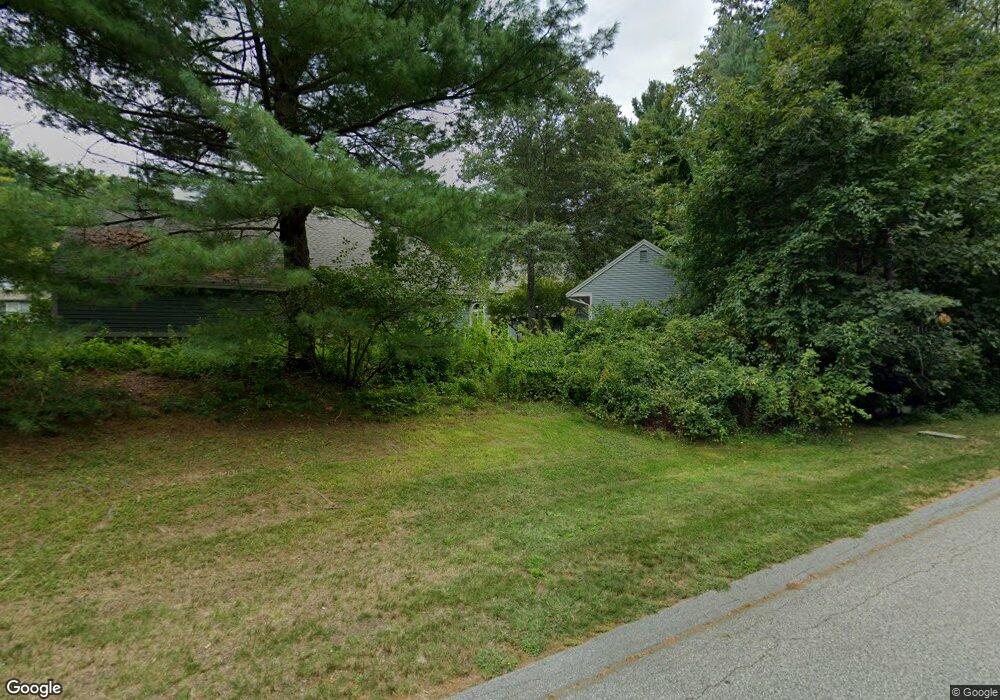
This home is located at 12 Deer Grass Ln, Acton, MA 01720 and is currently estimated at $899,736, approximately $369 per square foot. 12 Deer Grass Ln is a home located in Middlesex County with nearby schools including Acton-Boxborough Regional High School and Oak Meadow Montessori School.
Ownership History
Date
Name
Owned For
Owner Type
Purchase Details
Closed on
Jun 11, 2002
Sold by
Engle J Melville J and Engle Shirley W
Bought by
Brownlee Nicholas R and Brownlee Veronica H
Current Estimated Value
Home Financials for this Owner
Home Financials are based on the most recent Mortgage that was taken out on this home.
Original Mortgage
$391,000
Interest Rate
6.9%
Mortgage Type
Purchase Money Mortgage
Purchase Details
Closed on
Mar 14, 1997
Sold by
Lich Nancy L
Bought by
Engle Shirley W and Melville Engle J
Purchase Details
Closed on
Jun 15, 1994
Sold by
Bernard Betsy J
Bought by
Lich Leroy J and Lich Nancy L
Purchase Details
Closed on
Dec 4, 1991
Sold by
First Main St Corp
Bought by
Bernard Betsy J
Create a Home Valuation Report for This Property
The Home Valuation Report is an in-depth analysis detailing your home's value as well as a comparison with similar homes in the area
Home Values in the Area
Average Home Value in this Area
Purchase History
| Date | Buyer | Sale Price | Title Company |
|---|---|---|---|
| Brownlee Nicholas R | $490,000 | -- | |
| Engle Shirley W | $320,000 | -- | |
| Engle Shirley W | $320,000 | -- | |
| Lich Leroy J | $325,000 | -- | |
| Lich Leroy J | $325,000 | -- | |
| Bernard Betsy J | $277,000 | -- | |
| Bernard Betsy J | $277,000 | -- |
Source: Public Records
Mortgage History
| Date | Status | Borrower | Loan Amount |
|---|---|---|---|
| Open | Bernard Betsy J | $392,000 | |
| Closed | Brownlee Nicholas R | $391,000 | |
| Closed | Bernard Betsy J | $50,000 |
Source: Public Records
Tax History
| Year | Tax Paid | Tax Assessment Tax Assessment Total Assessment is a certain percentage of the fair market value that is determined by local assessors to be the total taxable value of land and additions on the property. | Land | Improvement |
|---|---|---|---|---|
| 2025 | $13,633 | $794,900 | $0 | $794,900 |
| 2024 | $12,167 | $729,900 | $0 | $729,900 |
| 2023 | $11,498 | $654,800 | $0 | $654,800 |
| 2022 | $12,625 | $649,100 | $0 | $649,100 |
| 2021 | $11,707 | $578,700 | $0 | $578,700 |
| 2020 | $10,807 | $561,700 | $0 | $561,700 |
| 2019 | $11,397 | $588,400 | $0 | $588,400 |
| 2018 | $11,531 | $595,000 | $0 | $595,000 |
| 2017 | $10,704 | $561,600 | $0 | $561,600 |
| 2016 | $9,305 | $483,900 | $0 | $483,900 |
| 2015 | $9,357 | $491,200 | $0 | $491,200 |
| 2014 | $9,739 | $500,700 | $0 | $500,700 |
Source: Public Records
Map
Nearby Homes
- 10 Blue Heron Way Unit 10
- 10 Blue Heron Way
- 18 Quail Run Unit 18
- 11 Davis Rd Unit A5
- 11 Davis Rd Unit B8
- 15 Davis Rd Unit B11
- 15 Davis Rd Unit B-8
- 11 Longmeadow Way
- 7 Grace Path
- 12 Gabriel Ln
- 380 Great Rd Unit B301
- 380A Great Rd Unit 301
- 388 Great Rd Unit A9
- 420 Great Rd Unit B3
- 35 Greenside Ln Unit 35
- 2 Duston Ln
- 5 Samantha Way Unit 5
- 134 Pope Rd
- 524 Main St
- 159 Skyline Dr Unit 159
- 10 Deer Grass Ln
- 8 Deer Grass Ln
- 12 Deer Grass Ln Unit 12
- 4 Deer Grass Ln
- 6 Deer Grass Ln
- 2 Deer Grass Ln
- 2 Deer Grass Ln Unit 2,2
- 2 Blue Heron Way
- 12 Blue Heron Way
- 15 Blue Heron Way
- 11 Blue Heron Way
- 9 Blue Heron Way
- 9 Blue Heron Way Unit 9, Acton Ma 01720
- 1 Blue Heron Way
- 7 Blue Heron Way
- 5 Blue Heron Way
- 17 Blue Heron Way
- 3 Blue Heron Way
- 3 Blue Heron Way Unit 3
- 8 Blue Heron Way
Your Personal Tour Guide
Ask me questions while you tour the home.