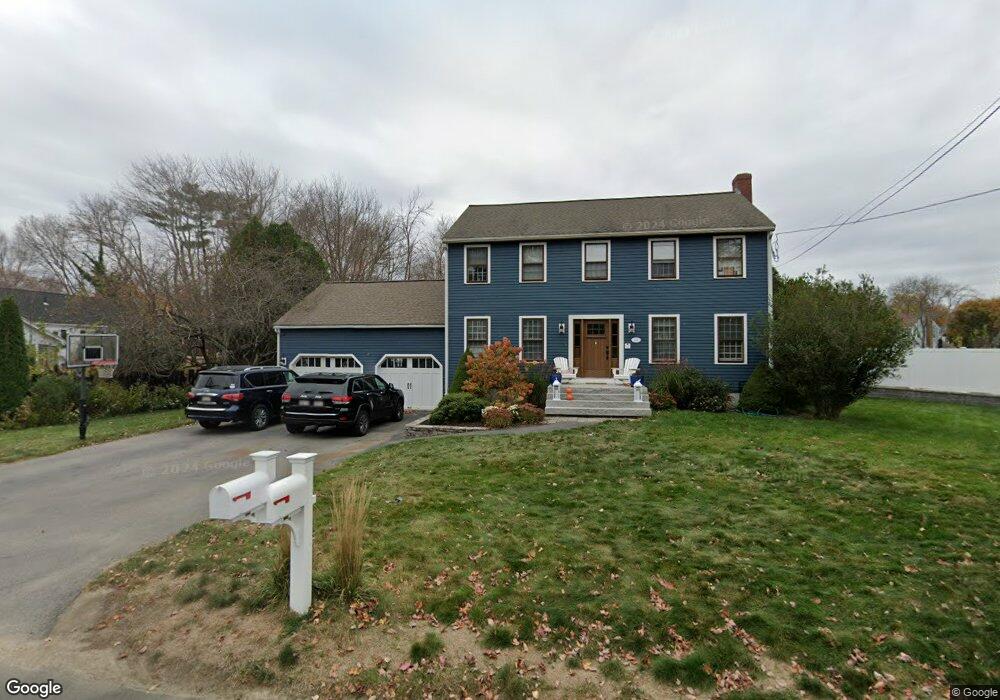
12 Dennett Dr Newburyport, MA 01950
Estimated Value: $1,089,000 - $1,303,000
4
Beds
2
Baths
1,988
Sq Ft
$586/Sq Ft
Est. Value
About This Home
This home is located at 12 Dennett Dr, Newburyport, MA 01950 and is currently estimated at $1,165,656, approximately $586 per square foot. 12 Dennett Dr is a home located in Essex County with nearby schools including Francis T. Bresnahan Elementary School, Edward G. Molin Elementary School, and Rupert A. Nock Middle School.
Ownership History
Date
Name
Owned For
Owner Type
Purchase Details
Closed on
May 20, 2011
Sold by
Lappin Bonnie
Bought by
Spinney Michael J and Spinney Kristin L
Current Estimated Value
Home Financials for this Owner
Home Financials are based on the most recent Mortgage that was taken out on this home.
Original Mortgage
$399,606
Outstanding Balance
$263,832
Interest Rate
3.75%
Mortgage Type
FHA
Estimated Equity
$901,824
Purchase Details
Closed on
Jun 11, 2004
Sold by
Onore Jeffrey
Bought by
Lappin Bonnie
Purchase Details
Closed on
Jul 19, 1993
Sold by
Mcginn David R and Mcginn Dorothy
Bought by
Onore Jeff and Lappin Bonnie
Create a Home Valuation Report for This Property
The Home Valuation Report is an in-depth analysis detailing your home's value as well as a comparison with similar homes in the area
Home Values in the Area
Average Home Value in this Area
Purchase History
| Date | Buyer | Sale Price | Title Company |
|---|---|---|---|
| Spinney Michael J | $410,000 | -- | |
| Lappin Bonnie | -- | -- | |
| Onore Jeff | $198,000 | -- |
Source: Public Records
Mortgage History
| Date | Status | Borrower | Loan Amount |
|---|---|---|---|
| Open | Onore Jeff | $50,000 | |
| Open | Onore Jeff | $399,606 |
Source: Public Records
Tax History Compared to Growth
Tax History
| Year | Tax Paid | Tax Assessment Tax Assessment Total Assessment is a certain percentage of the fair market value that is determined by local assessors to be the total taxable value of land and additions on the property. | Land | Improvement |
|---|---|---|---|---|
| 2025 | $9,218 | $962,200 | $477,900 | $484,300 |
| 2024 | $9,027 | $905,400 | $434,400 | $471,000 |
| 2023 | $7,985 | $743,500 | $377,800 | $365,700 |
| 2022 | $7,803 | $649,700 | $314,700 | $335,000 |
| 2021 | $7,592 | $600,600 | $286,200 | $314,400 |
| 2020 | $7,528 | $586,300 | $286,200 | $300,100 |
| 2019 | $7,669 | $586,300 | $286,200 | $300,100 |
| 2018 | $7,370 | $555,800 | $272,700 | $283,100 |
| 2017 | $7,367 | $547,700 | $259,800 | $287,900 |
| 2016 | $6,802 | $508,000 | $236,600 | $271,400 |
| 2015 | $6,777 | $508,000 | $236,600 | $271,400 |
Source: Public Records
Map
Nearby Homes