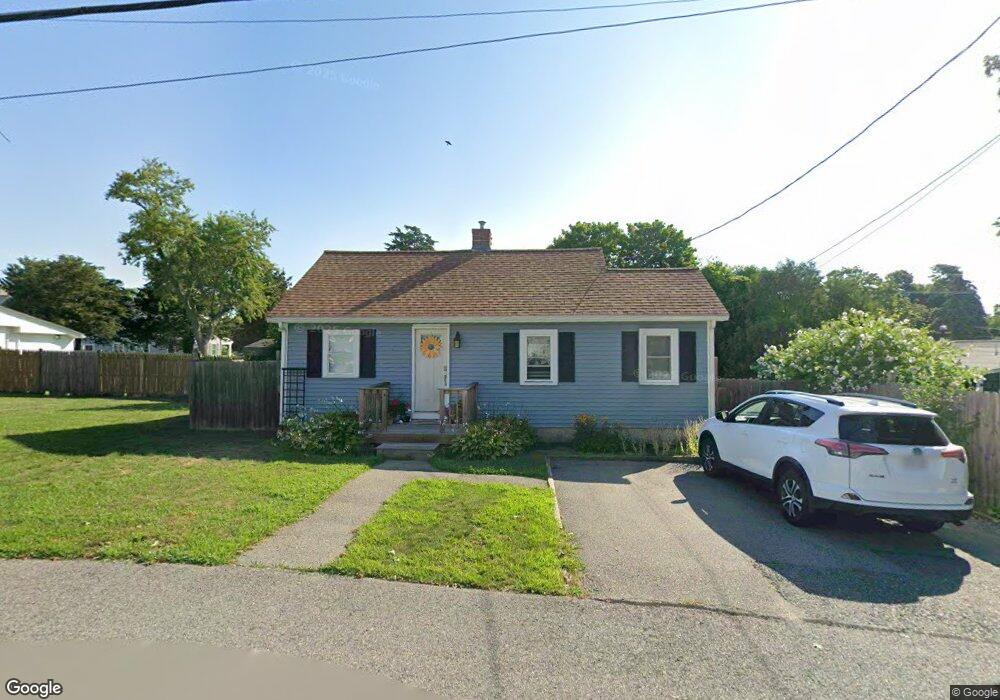
12 Dundee Dr Marshfield, MA 02050
Ocean Bluff-Brant Rock NeighborhoodEstimated Value: $527,000 - $574,000
3
Beds
1
Bath
1,000
Sq Ft
$560/Sq Ft
Est. Value
About This Home
This home is located at 12 Dundee Dr, Marshfield, MA 02050 and is currently estimated at $559,840, approximately $559 per square foot. 12 Dundee Dr is a home located in Plymouth County with nearby schools including Governor Edward Winslow School, Furnace Brook Middle School, and Marshfield High School.
Ownership History
Date
Name
Owned For
Owner Type
Purchase Details
Closed on
Feb 10, 2017
Sold by
Kelliher Michael L
Bought by
Mccarthy Jeffrey A
Current Estimated Value
Home Financials for this Owner
Home Financials are based on the most recent Mortgage that was taken out on this home.
Original Mortgage
$248,530
Outstanding Balance
$205,479
Interest Rate
4.32%
Mortgage Type
VA
Estimated Equity
$354,361
Purchase Details
Closed on
Dec 12, 2001
Sold by
Holden John D and Holden Geraldine L
Bought by
Kelliher Michael L
Create a Home Valuation Report for This Property
The Home Valuation Report is an in-depth analysis detailing your home's value as well as a comparison with similar homes in the area
Home Values in the Area
Average Home Value in this Area
Purchase History
| Date | Buyer | Sale Price | Title Company |
|---|---|---|---|
| Mccarthy Jeffrey A | $243,300 | -- | |
| Kelliher Michael L | $194,000 | -- | |
| Kelliher Michael L | $194,000 | -- |
Source: Public Records
Mortgage History
| Date | Status | Borrower | Loan Amount |
|---|---|---|---|
| Open | Mccarthy Jeffrey A | $248,530 | |
| Closed | Mccarthy Jeffrey A | $248,530 | |
| Previous Owner | Kelliher Michael L | $210,000 |
Source: Public Records
Tax History Compared to Growth
Tax History
| Year | Tax Paid | Tax Assessment Tax Assessment Total Assessment is a certain percentage of the fair market value that is determined by local assessors to be the total taxable value of land and additions on the property. | Land | Improvement |
|---|---|---|---|---|
| 2025 | $4,858 | $490,700 | $317,600 | $173,100 |
| 2024 | $4,718 | $454,100 | $297,800 | $156,300 |
| 2023 | $4,505 | $411,700 | $268,000 | $143,700 |
| 2022 | $4,505 | $347,900 | $228,300 | $119,600 |
| 2021 | $4,160 | $315,400 | $218,400 | $97,000 |
| 2020 | $3,782 | $283,700 | $188,600 | $95,100 |
| 2019 | $3,658 | $273,400 | $188,600 | $84,800 |
| 2018 | $3,764 | $281,500 | $188,600 | $92,900 |
| 2017 | $3,654 | $266,300 | $178,700 | $87,600 |
| 2016 | $3,439 | $247,800 | $168,700 | $79,100 |
| 2015 | $3,208 | $241,400 | $168,700 | $72,700 |
| 2014 | $3,167 | $238,300 | $168,700 | $69,600 |
Source: Public Records
Map
Nearby Homes
- 78 Tower Ave
- 122 June St
- 256 Ocean St
- 106 Careswell St
- 19 2nd Rd
- 71 Gurnet Rd
- 38 Winthrop Dr
- 30 Chandler Dr
- 145 Peterson Path
- 42 Carr Rd
- 86 Barouche Dr
- 51 Wellington Ave
- 713 Webster St
- 1801 Ocean St Unit B31
- 92 Salt Meadow Waye
- 8 Duxbury St
- 184 King Phillips Pathe
- 431 Moraine St
- 68 Abrams Hill Rd
- 242 Enterprise St