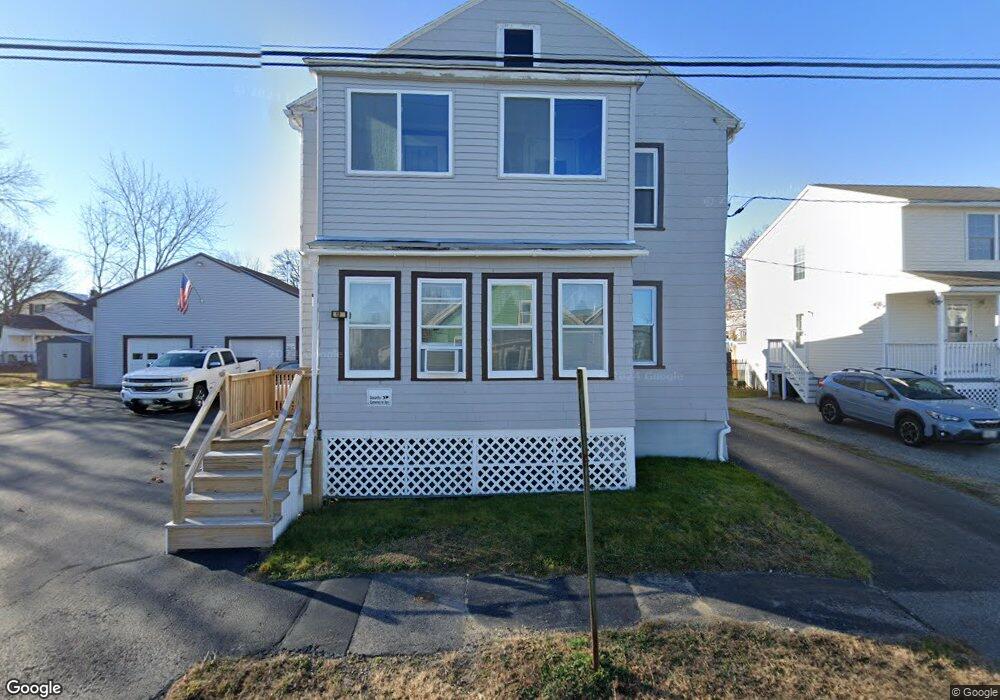
12 Dupont Ave Biddeford, ME 04005
Estimated Value: $455,000 - $558,000
5
Beds
2
Baths
1,872
Sq Ft
$271/Sq Ft
Est. Value
About This Home
This home is located at 12 Dupont Ave, Biddeford, ME 04005 and is currently estimated at $506,781, approximately $270 per square foot. 12 Dupont Ave is a home located in York County with nearby schools including John F Kennedy Memorial School, Biddeford Primary School, and Biddeford Intermediate School.
Ownership History
Date
Name
Owned For
Owner Type
Purchase Details
Closed on
Nov 9, 2021
Sold by
Perry Dana A
Bought by
Perry Dana A and Perry Marjorie J
Current Estimated Value
Purchase Details
Closed on
Jul 21, 2009
Sold by
Rondeau Patricia A and Nadeau Helen
Bought by
Perry Dana A
Home Financials for this Owner
Home Financials are based on the most recent Mortgage that was taken out on this home.
Original Mortgage
$122,735
Interest Rate
5.31%
Mortgage Type
FHA
Create a Home Valuation Report for This Property
The Home Valuation Report is an in-depth analysis detailing your home's value as well as a comparison with similar homes in the area
Home Values in the Area
Average Home Value in this Area
Purchase History
| Date | Buyer | Sale Price | Title Company |
|---|---|---|---|
| Perry Dana A | -- | None Available | |
| Perry Dana A | -- | -- | |
| Perry Dana A | -- | -- |
Source: Public Records
Mortgage History
| Date | Status | Borrower | Loan Amount |
|---|---|---|---|
| Previous Owner | Perry Dana A | $10,000 | |
| Previous Owner | Perry Dana A | $122,735 |
Source: Public Records
Tax History Compared to Growth
Tax History
| Year | Tax Paid | Tax Assessment Tax Assessment Total Assessment is a certain percentage of the fair market value that is determined by local assessors to be the total taxable value of land and additions on the property. | Land | Improvement |
|---|---|---|---|---|
| 2024 | $4,451 | $313,000 | $145,700 | $167,300 |
| 2023 | $4,042 | $308,100 | $143,100 | $165,000 |
| 2022 | $3,428 | $208,900 | $80,700 | $128,200 |
| 2021 | $3,309 | $181,500 | $68,200 | $113,300 |
| 2020 | $3,216 | $160,400 | $62,000 | $98,400 |
| 2019 | $2,995 | $149,900 | $62,000 | $87,900 |
| 2018 | $2,953 | $149,900 | $62,000 | $87,900 |
| 2017 | $2,938 | $146,400 | $62,000 | $84,400 |
| 2016 | $2,908 | $146,400 | $62,000 | $84,400 |
| 2015 | $2,850 | $146,400 | $62,000 | $84,400 |
| 2014 | $2,780 | $146,400 | $62,000 | $84,400 |
| 2013 | -- | $189,900 | $73,800 | $116,100 |
Source: Public Records
Map
Nearby Homes