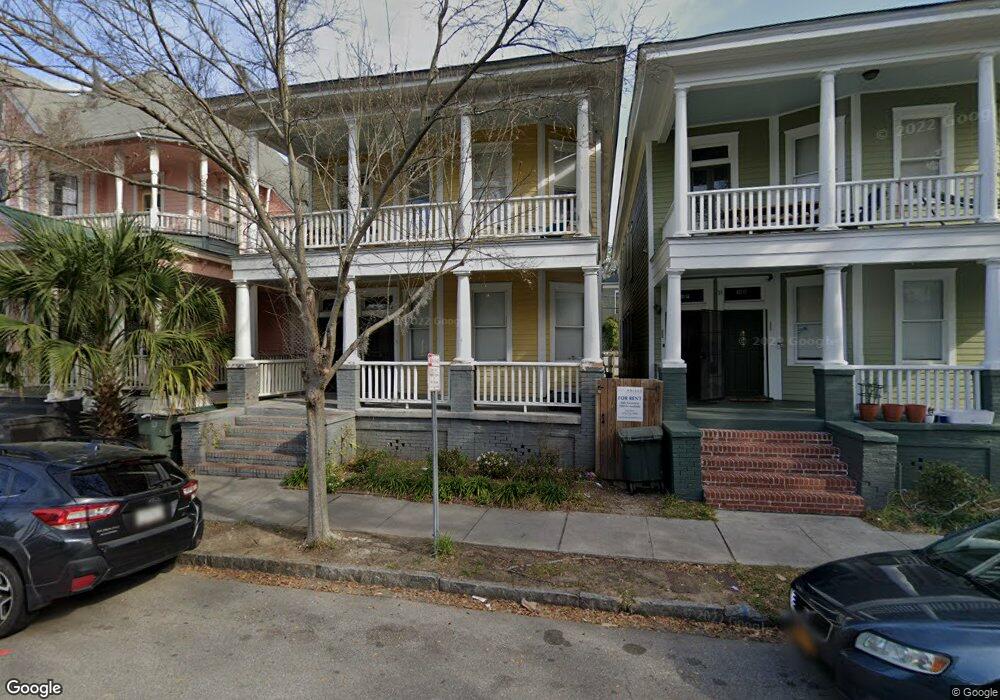
12 E 39th St Savannah, GA 31401
Thomas Square NeighborhoodEstimated Value: $704,997 - $941,000
4
Beds
3
Baths
2,684
Sq Ft
$307/Sq Ft
Est. Value
About This Home
This home is located at 12 E 39th St, Savannah, GA 31401 and is currently estimated at $823,749, approximately $306 per square foot. 12 E 39th St is a home located in Chatham County with nearby schools including Shuman Elementary School, Hubert Middle School, and Savannah Arts Academy.
Ownership History
Date
Name
Owned For
Owner Type
Purchase Details
Closed on
Jan 9, 2025
Sold by
12-14 39Th Street Llc
Bought by
A1 Sub B Llc
Current Estimated Value
Purchase Details
Closed on
Dec 13, 2018
Sold by
Martin Capers S
Bought by
12 14 39Th Street Llc
Home Financials for this Owner
Home Financials are based on the most recent Mortgage that was taken out on this home.
Original Mortgage
$546,000
Interest Rate
4.9%
Mortgage Type
Commercial
Purchase Details
Closed on
May 16, 2007
Sold by
Not Provided
Bought by
Martin Capers S
Create a Home Valuation Report for This Property
The Home Valuation Report is an in-depth analysis detailing your home's value as well as a comparison with similar homes in the area
Home Values in the Area
Average Home Value in this Area
Purchase History
We collect this data history from publicly available records. To have your information removed, we recommend requesting removal directly through your county’s website.
| Date | Buyer | Sale Price | Title Company |
|---|---|---|---|
| A1 Sub B Llc | -- | -- | |
| 12 14 39Th Street Llc | $776,000 | -- | |
| Martin Capers S | -- | -- |
Source: Public Records
Mortgage History
We collect this data history from publicly available records. To have your information removed, we recommend requesting removal directly through your county’s website.
| Date | Status | Borrower | Loan Amount |
|---|---|---|---|
| Previous Owner | 12 14 39Th Street Llc | $546,000 |
Source: Public Records
Tax History
| Year | Tax Paid | Tax Assessment Tax Assessment Total Assessment is a certain percentage of the fair market value that is determined by local assessors to be the total taxable value of land and additions on the property. | Land | Improvement |
|---|---|---|---|---|
| 2025 | $6,305 | $219,000 | $50,000 | $169,000 |
| 2024 | $41 | $219,000 | $50,000 | $169,000 |
| 2023 | $1,724 | $219,000 | $50,000 | $169,000 |
| 2022 | $4,355 | $141,280 | $26,000 | $115,280 |
| 2021 | $6,102 | $141,280 | $26,000 | $115,280 |
| 2020 | $4,091 | $141,280 | $26,000 | $115,280 |
| 2019 | $7,768 | $129,560 | $26,000 | $103,560 |
| 2018 | $5,730 | $127,400 | $26,000 | $101,400 |
| 2017 | $4,016 | $112,920 | $9,160 | $103,760 |
| 2016 | $2,606 | $111,680 | $9,160 | $102,520 |
| 2015 | $2,794 | $133,240 | $9,160 | $124,080 |
| 2014 | $3,717 | $120,880 | $0 | $0 |
Source: Public Records
Map
Nearby Homes
- 110 E 38th St
- 17 E 37th St Unit 3
- 17 E 37th St Unit 12
- 22 E 37th St
- 203 E 39th St
- 205 E 39th St
- 2310 Barnard St
- 11 E 41st St
- 217 E 38th St
- 21 W 36th St
- 2315 Barnard St
- 120 W 37th St
- 2114 Lincoln St
- 122 E 36th St
- 218 W 38th St
- 0 E Victory Dr Unit SA342445
- 221 W 39th St
- 223 W 38th St
- 304 W 38th St
- 310 W 39th St
- 14 E 39th St
- 10 E 39th St
- 16 E 39th St
- 18 E 39th St
- 11 E 38th St
- 9 E 38th St
- 2222 Bull St
- 2222 Bull St Unit A
- 2222 Bull St Unit B
- 2222 Bull St Unit 2nd floor
- 2222 Bull St Unit $/Amt/Yr
- 11 E 39th St
- 5 E 38th St Unit 5 e 38th
- 5 E 38th St
- 11 & 13 E 39th St
- 13 E 39th St
- 15 E 38th St
- 19 E 39th St
- 15 E 39th St
- 17 E 38th St
Your Personal Tour Guide
Ask me questions while you tour the home.