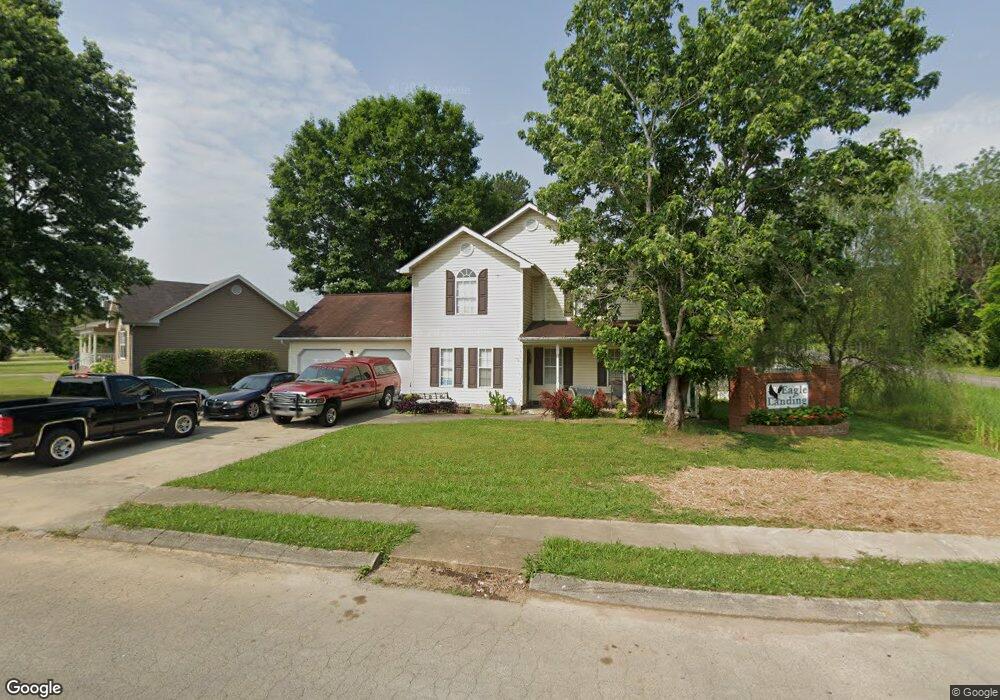
12 Eagle Landing Dr Flintstone, GA 30725
Flintstone NeighborhoodEstimated Value: $257,490 - $316,000
3
Beds
3
Baths
1,624
Sq Ft
$174/Sq Ft
Est. Value
About This Home
This home is located at 12 Eagle Landing Dr, Flintstone, GA 30725 and is currently estimated at $282,373, approximately $173 per square foot. 12 Eagle Landing Dr is a home located in Walker County with nearby schools including Chattanooga Valley Elementary School, Chattanooga Valley Middle School, and Ridgeland High School.
Ownership History
Date
Name
Owned For
Owner Type
Purchase Details
Closed on
Nov 14, 2011
Bought by
Walker Kimberly
Current Estimated Value
Home Financials for this Owner
Home Financials are based on the most recent Mortgage that was taken out on this home.
Original Mortgage
$94,541
Outstanding Balance
$63,593
Interest Rate
4.12%
Mortgage Type
FHA
Estimated Equity
$218,780
Purchase Details
Closed on
Feb 1, 2011
Sold by
Steele Calvin
Bought by
Hsbc Mtg Svcs Inc
Purchase Details
Closed on
Sep 10, 2004
Sold by
Padgett Janelle and Padgett Brian
Bought by
Steele Calvin and Wf Robin
Purchase Details
Closed on
Nov 30, 2000
Sold by
Simerley C R Inc
Bought by
Padgett Janelle and Padgett Brian
Purchase Details
Closed on
Jul 28, 1998
Sold by
Baker & Summers Const Co Inc
Bought by
Simerley C R Inc
Purchase Details
Closed on
Jan 24, 1997
Sold by
Baker & Summers Const Co Inc
Bought by
Baker & Summers Const Co Inc
Purchase Details
Closed on
Jan 1, 1972
Bought by
Baker & Summers Const Co Inc
Create a Home Valuation Report for This Property
The Home Valuation Report is an in-depth analysis detailing your home's value as well as a comparison with similar homes in the area
Home Values in the Area
Average Home Value in this Area
Purchase History
| Date | Buyer | Sale Price | Title Company |
|---|---|---|---|
| Walker Kimberly | $97,000 | -- | |
| Hsbc Mtg Svcs Inc | $100,887 | -- | |
| Steele Calvin | $145,900 | -- | |
| Padgett Janelle | $119,000 | -- | |
| Simerley C R Inc | $30,000 | -- | |
| Baker & Summers Const Co Inc | -- | -- | |
| Baker & Summers Const Co Inc | -- | -- |
Source: Public Records
Mortgage History
| Date | Status | Borrower | Loan Amount |
|---|---|---|---|
| Open | Hsbc Mtg Svcs Inc | $94,541 |
Source: Public Records
Tax History
| Year | Tax Paid | Tax Assessment Tax Assessment Total Assessment is a certain percentage of the fair market value that is determined by local assessors to be the total taxable value of land and additions on the property. | Land | Improvement |
|---|---|---|---|---|
| 2025 | $1,958 | $88,438 | $11,000 | $77,438 |
| 2024 | $1,897 | $82,202 | $9,600 | $72,602 |
| 2023 | $1,854 | $78,552 | $9,600 | $68,952 |
| 2022 | $1,772 | $69,286 | $9,600 | $59,686 |
| 2021 | $1,733 | $61,080 | $9,600 | $51,480 |
| 2020 | $1,515 | $50,693 | $9,600 | $41,093 |
| 2019 | $1,542 | $50,693 | $9,600 | $41,093 |
| 2018 | $1,341 | $50,693 | $9,600 | $41,093 |
| 2017 | $1,680 | $50,693 | $9,600 | $41,093 |
| 2016 | $1,370 | $50,693 | $9,600 | $41,093 |
| 2015 | $1,661 | $58,782 | $9,600 | $49,182 |
| 2014 | $1,548 | $58,782 | $9,600 | $49,182 |
| 2013 | -- | $58,782 | $9,600 | $49,182 |
Source: Public Records
Map
Nearby Homes
- 16 Japonica St
- 22 Carmack Rd
- 19 Turkey Run
- 120 Williams Ave
- 152 Carmack Rd
- 33 Brumby Rd
- 102 W Schmitt Rd
- 309 W Schmitt Rd
- 404 W Schmitt Rd
- 115 Crestline Dr
- 196 North Ave
- 86 West Dr
- 52 Tower Dr
- 221 Highland Dr
- 130 Cascade Dr
- 125 Cascade Dr
- 270 Cascade Dr
- 228 Cascade Dr
- 1308 Dry Valley Rd
- 186 Haven Hill Ln
- 247 Eagle Landing Dr
- 34 Eagle Landing Dr
- 54 Eagle Landing Dr
- 4144 Chattanooga Valley Rd
- 9 Eagle Landing Dr
- 23 Eagle Landing Dr
- 68 Eagle Landing Dr
- 180 Eagle Landing Dr
- 37 Eagle Landing Dr
- 51 Eagle Landing Dr
- 86 Eagle Landing Dr
- 65 Eagle Landing Dr
- 4096 Chattanooga Valley Rd
- 102 Nancy Ln
- 83 Eagle Landing Dr
- 83 Eagle Landing Dr Unit RES
- 104 Eagle Landing Dr
- 104 Eagle Landing Dr Unit 32
- 124 Nancy Ln
- 101 Eagle Landing Dr
Your Personal Tour Guide
Ask me questions while you tour the home.