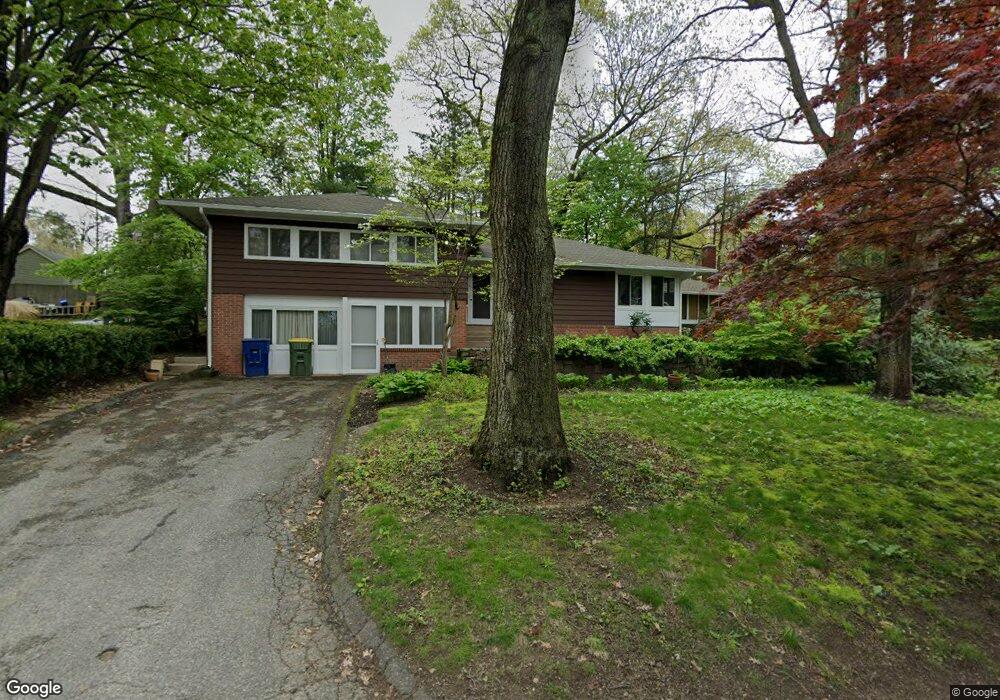
12 Eldridge St Waterbury, CT 06704
North End District NeighborhoodEstimated Value: $306,000 - $460,000
4
Beds
4
Baths
2,495
Sq Ft
$159/Sq Ft
Est. Value
About This Home
This home is located at 12 Eldridge St, Waterbury, CT 06704 and is currently estimated at $395,845, approximately $158 per square foot. 12 Eldridge St is a home located in New Haven County with nearby schools including F. J. Kingsbury School, North End Middle School, and Wilby High School.
Ownership History
Date
Name
Owned For
Owner Type
Purchase Details
Closed on
Apr 5, 2018
Sold by
Bonner Margie Est and Bonner
Bought by
Stein Jennifer
Current Estimated Value
Home Financials for this Owner
Home Financials are based on the most recent Mortgage that was taken out on this home.
Original Mortgage
$141,373
Outstanding Balance
$81,579
Interest Rate
3.85%
Mortgage Type
New Conventional
Estimated Equity
$314,266
Purchase Details
Closed on
Oct 15, 2012
Sold by
Bonner-Harrison Douglas
Bought by
Bonner Margie J
Home Financials for this Owner
Home Financials are based on the most recent Mortgage that was taken out on this home.
Original Mortgage
$100,000
Interest Rate
4%
Mortgage Type
New Conventional
Purchase Details
Closed on
Jan 1, 1975
Bought by
Bonner Margie J
Create a Home Valuation Report for This Property
The Home Valuation Report is an in-depth analysis detailing your home's value as well as a comparison with similar homes in the area
Home Values in the Area
Average Home Value in this Area
Purchase History
| Date | Buyer | Sale Price | Title Company |
|---|---|---|---|
| Stein Jennifer | $142,500 | -- | |
| Bonner Margie J | -- | -- | |
| Bonner Margie J | $39,000 | -- |
Source: Public Records
Mortgage History
| Date | Status | Borrower | Loan Amount |
|---|---|---|---|
| Open | Bonner Margie J | $141,373 | |
| Previous Owner | Bonner Margie J | $100,000 |
Source: Public Records
Tax History Compared to Growth
Tax History
| Year | Tax Paid | Tax Assessment Tax Assessment Total Assessment is a certain percentage of the fair market value that is determined by local assessors to be the total taxable value of land and additions on the property. | Land | Improvement |
|---|---|---|---|---|
| 2025 | $7,944 | $176,610 | $20,650 | $155,960 |
| 2024 | $8,732 | $176,610 | $20,650 | $155,960 |
| 2023 | $9,570 | $176,610 | $20,650 | $155,960 |
| 2022 | $6,403 | $106,340 | $20,670 | $85,670 |
| 2021 | $6,403 | $106,340 | $20,670 | $85,670 |
| 2020 | $6,403 | $106,340 | $20,670 | $85,670 |
| 2019 | $6,403 | $106,340 | $20,670 | $85,670 |
| 2018 | $6,403 | $106,340 | $20,670 | $85,670 |
| 2017 | $6,903 | $114,650 | $20,670 | $93,980 |
| 2016 | $6,903 | $114,650 | $20,670 | $93,980 |
| 2015 | $6,675 | $114,650 | $20,670 | $93,980 |
| 2014 | $6,675 | $114,650 | $20,670 | $93,980 |
Source: Public Records
Map
Nearby Homes