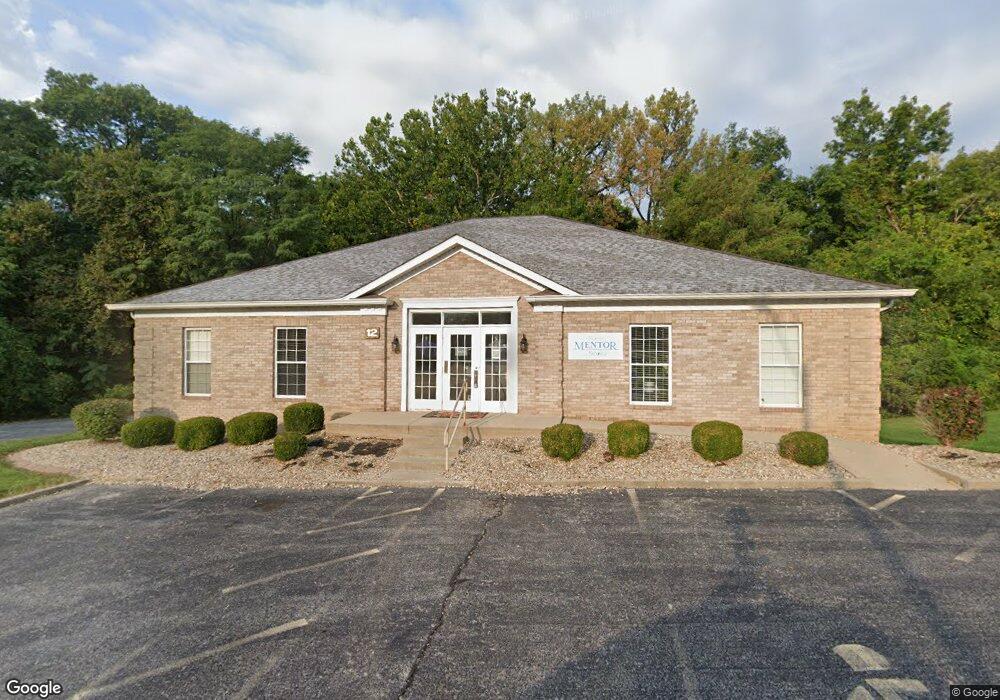
12 Emerald Terrace Swansea, IL 62226
--
Bed
--
Bath
2,950
Sq Ft
4,792
Sq Ft Lot
About This Home
This home is located at 12 Emerald Terrace, Swansea, IL 62226. 12 Emerald Terrace is a home located in St. Clair County with nearby schools including Wolf Branch Elementary School, Wolf Branch Middle School, and Elite Scholars STEAM Academy.
Ownership History
Date
Name
Owned For
Owner Type
Purchase Details
Closed on
Sep 18, 2019
Sold by
Buy Sell Action Llc
Bought by
Rossman Partners Swansea Llc
Home Financials for this Owner
Home Financials are based on the most recent Mortgage that was taken out on this home.
Original Mortgage
$600,000
Interest Rate
3.7%
Mortgage Type
Construction
Purchase Details
Closed on
Dec 26, 2014
Sold by
Commerce Bank
Bought by
Buy Sell Action Llc
Home Financials for this Owner
Home Financials are based on the most recent Mortgage that was taken out on this home.
Original Mortgage
$551,700
Interest Rate
3.95%
Mortgage Type
Commercial
Purchase Details
Closed on
Feb 6, 2014
Sold by
Tsct Properties Llc
Bought by
Commerce Bank
Purchase Details
Closed on
Apr 9, 2008
Sold by
Maxwell & Kirk Ii Inc
Bought by
Tsct Properties Llc
Home Financials for this Owner
Home Financials are based on the most recent Mortgage that was taken out on this home.
Original Mortgage
$360,000
Interest Rate
6.12%
Mortgage Type
Commercial
Create a Home Valuation Report for This Property
The Home Valuation Report is an in-depth analysis detailing your home's value as well as a comparison with similar homes in the area
Home Values in the Area
Average Home Value in this Area
Purchase History
| Date | Buyer | Sale Price | Title Company |
|---|---|---|---|
| Rossman Partners Swansea Llc | $305,000 | Greater Illinois Title Co | |
| Buy Sell Action Llc | $200,000 | None Available | |
| Commerce Bank | -- | None Available | |
| Tsct Properties Llc | $400,000 | Community Title Shiloh Llc |
Source: Public Records
Mortgage History
| Date | Status | Borrower | Loan Amount |
|---|---|---|---|
| Previous Owner | Rossman Partners Swansea Llc | $600,000 | |
| Previous Owner | Buy Sell Action Llc | $551,700 | |
| Previous Owner | Tsct Properties Llc | $360,000 |
Source: Public Records
Tax History Compared to Growth
Tax History
| Year | Tax Paid | Tax Assessment Tax Assessment Total Assessment is a certain percentage of the fair market value that is determined by local assessors to be the total taxable value of land and additions on the property. | Land | Improvement |
|---|---|---|---|---|
| 2024 | $11,940 | $148,541 | $12,577 | $135,964 |
| 2023 | $9,756 | $120,220 | $12,403 | $107,817 |
| 2022 | $9,145 | $109,490 | $11,296 | $98,194 |
| 2021 | $11,376 | $133,572 | $10,833 | $122,739 |
| 2020 | $11,076 | $124,393 | $10,088 | $114,305 |
| 2019 | $11,267 | $129,832 | $10,295 | $119,537 |
| 2018 | $10,988 | $126,517 | $10,032 | $116,485 |
| 2017 | $10,711 | $123,150 | $9,765 | $113,385 |
| 2016 | $10,633 | $118,905 | $9,428 | $109,477 |
| 2014 | $12,734 | $160,500 | $14,230 | $146,270 |
| 2013 | $8,573 | $160,500 | $14,230 | $146,270 |
Source: Public Records
Map
Nearby Homes
- 34 Twilight Dr
- 2 Mercury Dr
- 110 Fullerton Rd
- 0 Smelting Works Rd
- 3434 Whistling Cove
- 212 Castellano Dr
- 525 Big Bend Blvd
- 155 Marilyn Ave
- 145 Marilyn Dr
- 20 Chaucer Dr
- 1518 William Ln
- 117 Timber Dr
- 505 Thistle Ln
- 1900 N 17th St
- 104 Britanna Dr
- 3232 Joel Dr
- 1903 N 17th St
- 1708 Anna Rose Dr
- Bristol Villa Plan at Belleville - Belleville Refresh
- Titan Plan at Belleville - Belleville Refresh
- 11 Emerald Terrace
- 16 Emerald Terrace
- 3103 N Illinois St
- 1 Emerald Terrace
- 2 Emerald Terrace Unit 2
- 3115 N Illinois St
- 3214 Wolf Meadow
- 3114 N Illinois St
- 3210 Wolf Meadow
- 3218 Wolf Meadow
- 3206 Wolf Meadow
- 3118 N Illinois St
- 0 N Illinois St
- 3213 Wolf Meadow
- 3224 Wolf Meadow
- 3205 Wolf Meadow
- 32 Wolf Creek Dr
- 204 Piney Woods Dr
- 3209 Wolf Meadow
- 148 Piney Woods Dr