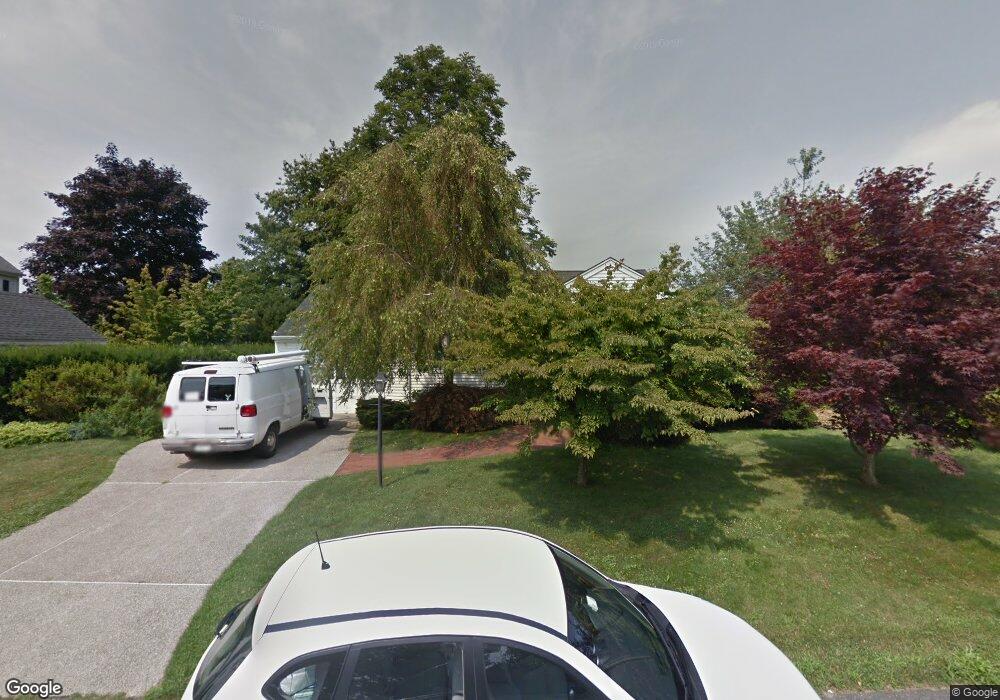
12 Everett St Middletown, RI 02842
Estimated Value: $494,000 - $650,000
2
Beds
1
Bath
1,017
Sq Ft
$571/Sq Ft
Est. Value
About This Home
This home is located at 12 Everett St, Middletown, RI 02842 and is currently estimated at $580,532, approximately $570 per square foot. 12 Everett St is a home located in Newport County with nearby schools including Middletown High School, St Michael's Country Day School, and All Saints STEAM Academy.
Ownership History
Date
Name
Owned For
Owner Type
Purchase Details
Closed on
Jan 22, 2013
Sold by
Gibson Lawrence J Est
Bought by
Erice Francesca
Current Estimated Value
Home Financials for this Owner
Home Financials are based on the most recent Mortgage that was taken out on this home.
Original Mortgage
$172,000
Outstanding Balance
$119,280
Interest Rate
3.39%
Mortgage Type
New Conventional
Estimated Equity
$461,252
Purchase Details
Closed on
Jan 25, 1996
Sold by
Vanicek Bruce A
Bought by
Falkenholm Karl E and Falkenholm Mildred
Purchase Details
Closed on
Aug 31, 1990
Sold by
Bloomfield Theresa
Bought by
Vanicek Bruce
Home Financials for this Owner
Home Financials are based on the most recent Mortgage that was taken out on this home.
Original Mortgage
$105,600
Interest Rate
9.85%
Create a Home Valuation Report for This Property
The Home Valuation Report is an in-depth analysis detailing your home's value as well as a comparison with similar homes in the area
Home Values in the Area
Average Home Value in this Area
Purchase History
| Date | Buyer | Sale Price | Title Company |
|---|---|---|---|
| Erice Francesca | $230,000 | -- | |
| Falkenholm Karl E | $140,000 | -- | |
| Vanicek Bruce | $142,000 | -- |
Source: Public Records
Mortgage History
| Date | Status | Borrower | Loan Amount |
|---|---|---|---|
| Open | Vanicek Bruce | $172,000 | |
| Previous Owner | Vanicek Bruce | $105,600 |
Source: Public Records
Tax History
| Year | Tax Paid | Tax Assessment Tax Assessment Total Assessment is a certain percentage of the fair market value that is determined by local assessors to be the total taxable value of land and additions on the property. | Land | Improvement |
|---|---|---|---|---|
| 2025 | $6,345 | $538,200 | $382,100 | $156,100 |
| 2024 | $6,060 | $538,200 | $382,100 | $156,100 |
| 2023 | $4,087 | $324,600 | $205,400 | $119,200 |
| 2022 | $3,902 | $324,600 | $205,400 | $119,200 |
| 2021 | $3,902 | $324,600 | $205,400 | $119,200 |
| 2020 | $3,849 | $279,700 | $157,200 | $122,500 |
| 2018 | $3,846 | $279,700 | $157,200 | $122,500 |
| 2016 | $3,715 | $240,900 | $133,800 | $107,100 |
| 2015 | $3,623 | $240,900 | $133,800 | $107,100 |
| 2014 | $3,735 | $232,400 | $121,500 | $110,900 |
| 2013 | $3,651 | $232,400 | $121,500 | $110,900 |
Source: Public Records
Map
Nearby Homes
- 149 W Main Rd
- 7 Restmere Terrace
- 23 Livingston Place
- 1 Shangri-La Ln
- 19 Vernon Ave
- 138 Green End Ave
- 5 Elliot Place
- 51 Smythe St
- 10 Smithfield Dr
- 19 Greene Ln
- 14 Kay Blvd
- 74 Valley Rd
- 1 Arnold Ave
- 66 Girard Ave Unit 106
- 12 Mariner Way
- 55 John Clarke Rd Unit 8
- 55 John Clarke Rd Unit 3
- 61 Gibbs Ave
- 16 Dartmouth St
- 27 Hall Ave
Your Personal Tour Guide
Ask me questions while you tour the home.