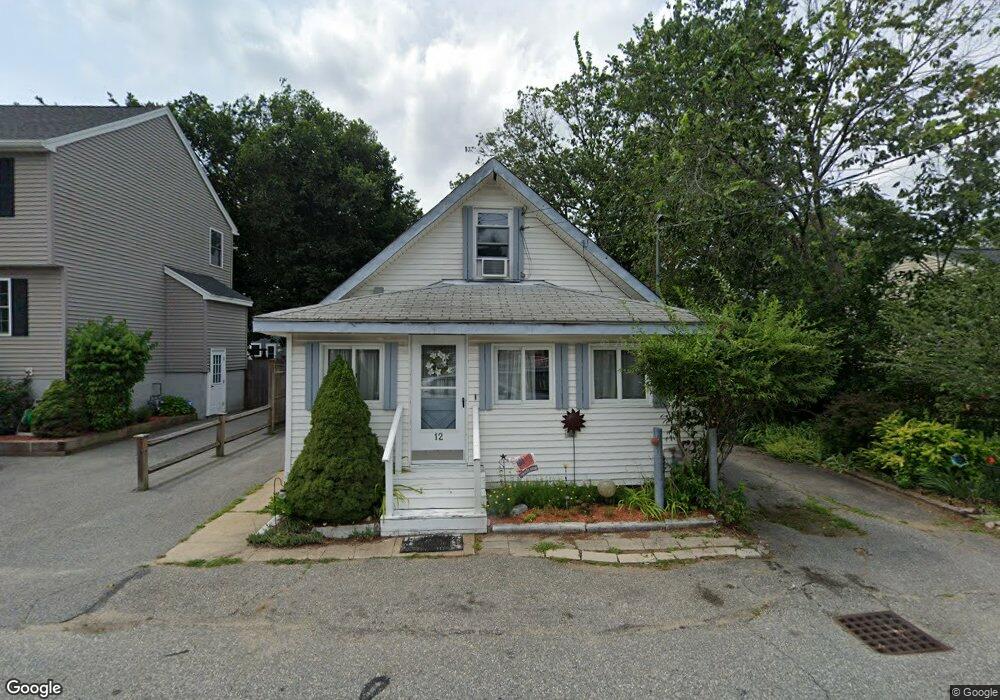
12 Faulkner Ave Wilmington, MA 01887
Estimated Value: $448,828 - $535,000
3
Beds
1
Bath
1,052
Sq Ft
$479/Sq Ft
Est. Value
About This Home
This home is located at 12 Faulkner Ave, Wilmington, MA 01887 and is currently estimated at $503,957, approximately $479 per square foot. 12 Faulkner Ave is a home located in Middlesex County with nearby schools including Wilmington Middle School, Wilmington High School, and Abundant Life Christian School and Childcare.
Ownership History
Date
Name
Owned For
Owner Type
Purchase Details
Closed on
Apr 30, 2007
Sold by
Vonherrmann Robbin J
Bought by
Strob Anthony J
Current Estimated Value
Home Financials for this Owner
Home Financials are based on the most recent Mortgage that was taken out on this home.
Original Mortgage
$196,800
Outstanding Balance
$119,773
Interest Rate
6.18%
Mortgage Type
Purchase Money Mortgage
Estimated Equity
$384,184
Purchase Details
Closed on
Jul 30, 1996
Sold by
Goggin John P and Coggin Catherine
Bought by
Vonherrmann Robbin
Home Financials for this Owner
Home Financials are based on the most recent Mortgage that was taken out on this home.
Original Mortgage
$112,628
Interest Rate
8.37%
Mortgage Type
Purchase Money Mortgage
Create a Home Valuation Report for This Property
The Home Valuation Report is an in-depth analysis detailing your home's value as well as a comparison with similar homes in the area
Home Values in the Area
Average Home Value in this Area
Purchase History
| Date | Buyer | Sale Price | Title Company |
|---|---|---|---|
| Strob Anthony J | $246,000 | -- | |
| Vonherrmann Robbin | $116,000 | -- |
Source: Public Records
Mortgage History
| Date | Status | Borrower | Loan Amount |
|---|---|---|---|
| Open | Strob Anthony J | $196,800 | |
| Previous Owner | Vonherrmann Robbin | $142,400 | |
| Previous Owner | Vonherrmann Robbin | $112,628 |
Source: Public Records
Tax History Compared to Growth
Tax History
| Year | Tax Paid | Tax Assessment Tax Assessment Total Assessment is a certain percentage of the fair market value that is determined by local assessors to be the total taxable value of land and additions on the property. | Land | Improvement |
|---|---|---|---|---|
| 2025 | $4,187 | $365,700 | $225,400 | $140,300 |
| 2024 | $4,154 | $363,400 | $225,400 | $138,000 |
| 2023 | $4,006 | $335,500 | $204,900 | $130,600 |
| 2022 | $3,684 | $282,700 | $170,800 | $111,900 |
| 2021 | $3,740 | $270,200 | $155,200 | $115,000 |
| 2020 | $3,588 | $264,200 | $155,200 | $109,000 |
| 2019 | $3,343 | $243,100 | $147,800 | $95,300 |
| 2018 | $3,297 | $228,800 | $140,800 | $88,000 |
| 2017 | $3,154 | $218,300 | $134,100 | $84,200 |
| 2016 | $2,865 | $195,800 | $127,700 | $68,100 |
| 2015 | $2,749 | $191,300 | $127,700 | $63,600 |
| 2014 | $2,563 | $180,000 | $121,600 | $58,400 |
Source: Public Records
Map
Nearby Homes