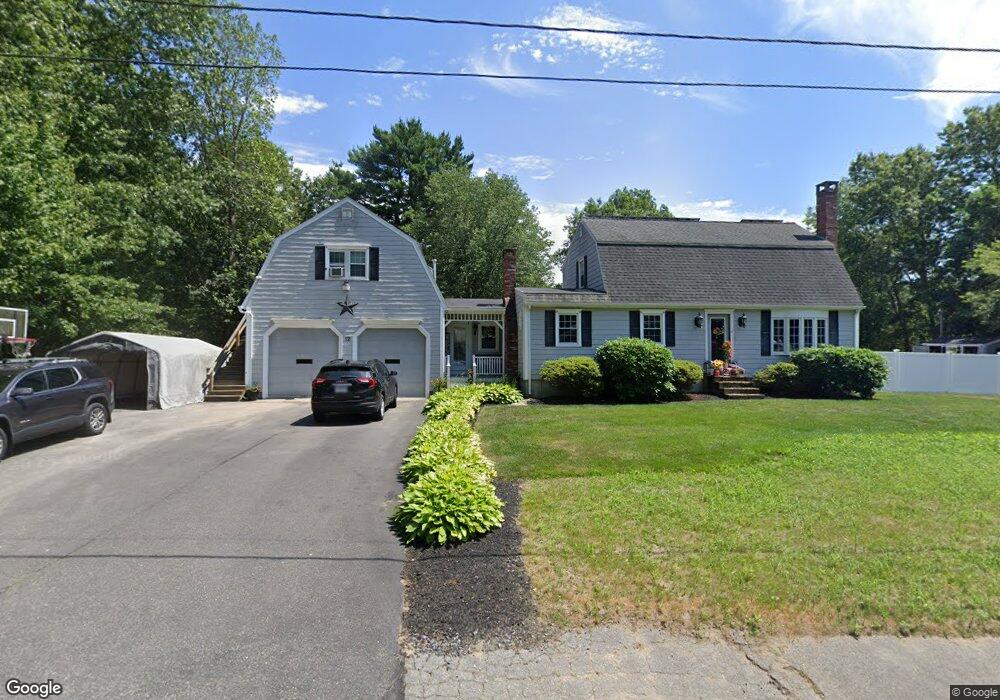
12 Finney St Carver, MA 02330
Estimated Value: $496,000 - $861,000
6
Beds
3
Baths
3,109
Sq Ft
$229/Sq Ft
Est. Value
About This Home
This home is located at 12 Finney St, Carver, MA 02330 and is currently estimated at $713,286, approximately $229 per square foot. 12 Finney St is a home located in Plymouth County with nearby schools including Carver Elementary School, Carver Middle/High School, and Samuel Fuller School.
Ownership History
Date
Name
Owned For
Owner Type
Purchase Details
Closed on
Nov 21, 2014
Sold by
Gilbert 3Rd William M and Gilbert Kathy J
Bought by
Dern Michael J and Dern Nicole L
Current Estimated Value
Home Financials for this Owner
Home Financials are based on the most recent Mortgage that was taken out on this home.
Original Mortgage
$239,000
Outstanding Balance
$183,956
Interest Rate
4.13%
Mortgage Type
New Conventional
Estimated Equity
$529,330
Create a Home Valuation Report for This Property
The Home Valuation Report is an in-depth analysis detailing your home's value as well as a comparison with similar homes in the area
Home Values in the Area
Average Home Value in this Area
Purchase History
| Date | Buyer | Sale Price | Title Company |
|---|---|---|---|
| Dern Michael J | $298,750 | -- |
Source: Public Records
Mortgage History
| Date | Status | Borrower | Loan Amount |
|---|---|---|---|
| Open | Dern Michael J | $239,000 |
Source: Public Records
Tax History
| Year | Tax Paid | Tax Assessment Tax Assessment Total Assessment is a certain percentage of the fair market value that is determined by local assessors to be the total taxable value of land and additions on the property. | Land | Improvement |
|---|---|---|---|---|
| 2025 | $8,939 | $644,500 | $130,700 | $513,800 |
| 2024 | $8,322 | $587,300 | $128,200 | $459,100 |
| 2023 | $7,969 | $546,200 | $128,200 | $418,000 |
| 2022 | $7,555 | $472,800 | $109,600 | $363,200 |
| 2021 | $7,313 | $431,700 | $97,800 | $333,900 |
| 2020 | $6,988 | $406,500 | $91,400 | $315,100 |
| 2019 | $6,818 | $399,900 | $88,800 | $311,100 |
| 2018 | $6,542 | $371,100 | $88,800 | $282,300 |
| 2017 | $6,041 | $341,500 | $85,400 | $256,100 |
| 2016 | $5,436 | $319,200 | $81,300 | $237,900 |
| 2015 | $5,280 | $310,400 | $81,300 | $229,100 |
| 2014 | $5,094 | $299,500 | $102,800 | $196,700 |
Source: Public Records
Map
Nearby Homes
Your Personal Tour Guide
Ask me questions while you tour the home.