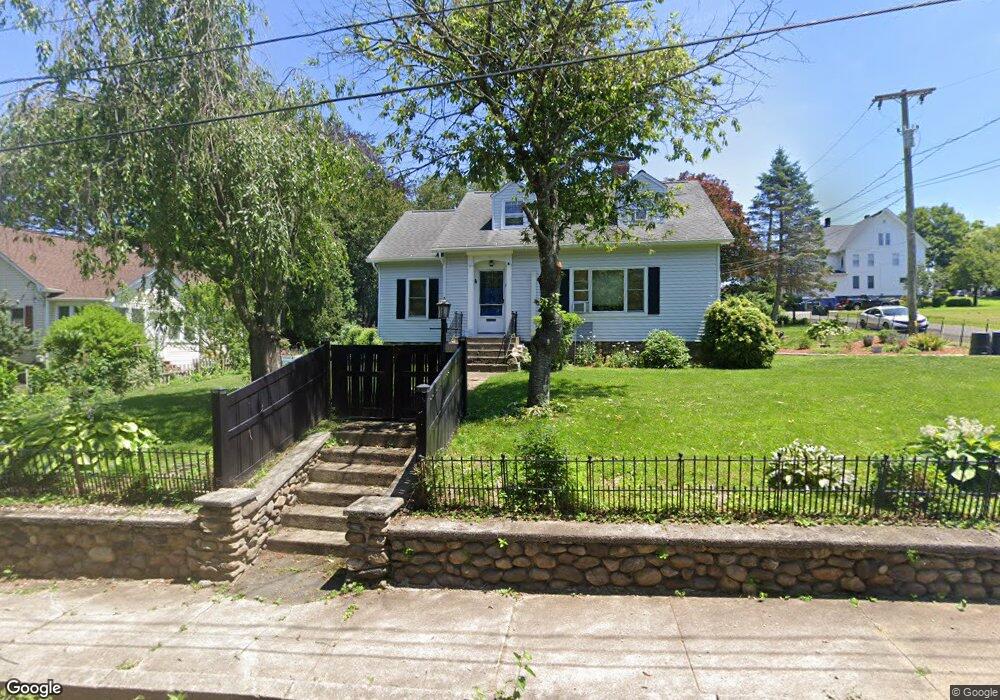
12 First Ave Seymour, CT 06483
Estimated Value: $408,993 - $477,000
4
Beds
2
Baths
2,113
Sq Ft
$206/Sq Ft
Est. Value
About This Home
This home is located at 12 First Ave, Seymour, CT 06483 and is currently estimated at $435,998, approximately $206 per square foot. 12 First Ave is a home located in New Haven County with nearby schools including Seymour Middle School, Seymour High School, and Assumption School.
Ownership History
Date
Name
Owned For
Owner Type
Purchase Details
Closed on
Feb 11, 2021
Sold by
Laughner Shawn P
Bought by
Mabasa Mylene S
Current Estimated Value
Home Financials for this Owner
Home Financials are based on the most recent Mortgage that was taken out on this home.
Original Mortgage
$234,000
Outstanding Balance
$209,106
Interest Rate
2.65%
Mortgage Type
Purchase Money Mortgage
Estimated Equity
$226,892
Purchase Details
Closed on
Aug 6, 2019
Sold by
Laughner Jackalynn
Bought by
Laughner Shawn
Purchase Details
Closed on
Apr 29, 1997
Sold by
Chatfield Beryl B
Bought by
Craven John T and Craven Leda M
Home Financials for this Owner
Home Financials are based on the most recent Mortgage that was taken out on this home.
Original Mortgage
$70,000
Interest Rate
5.75%
Mortgage Type
Unknown
Create a Home Valuation Report for This Property
The Home Valuation Report is an in-depth analysis detailing your home's value as well as a comparison with similar homes in the area
Home Values in the Area
Average Home Value in this Area
Purchase History
| Date | Buyer | Sale Price | Title Company |
|---|---|---|---|
| Mabasa Mylene S | $260,000 | None Available | |
| Laughner Shawn | -- | -- | |
| Craven John T | $135,000 | -- |
Source: Public Records
Mortgage History
| Date | Status | Borrower | Loan Amount |
|---|---|---|---|
| Open | Mabasa Mylene S | $234,000 | |
| Previous Owner | Craven John T | $190,000 | |
| Previous Owner | Craven John T | $80,000 | |
| Previous Owner | Craven John T | $70,000 |
Source: Public Records
Tax History Compared to Growth
Tax History
| Year | Tax Paid | Tax Assessment Tax Assessment Total Assessment is a certain percentage of the fair market value that is determined by local assessors to be the total taxable value of land and additions on the property. | Land | Improvement |
|---|---|---|---|---|
| 2025 | $7,591 | $273,840 | $33,600 | $240,240 |
| 2024 | $6,499 | $176,400 | $26,810 | $149,590 |
| 2023 | $6,347 | $176,400 | $26,810 | $149,590 |
| 2022 | $6,278 | $176,400 | $26,810 | $149,590 |
| 2021 | $6,123 | $176,400 | $26,810 | $149,590 |
| 2020 | $5,423 | $150,640 | $31,500 | $119,140 |
| 2019 | $5,423 | $150,640 | $31,500 | $119,140 |
| 2018 | $5,423 | $150,640 | $31,500 | $119,140 |
| 2017 | $5,368 | $149,100 | $31,500 | $117,600 |
| 2016 | $5,368 | $149,100 | $31,500 | $117,600 |
| 2015 | $4,981 | $143,990 | $35,280 | $108,710 |
| 2014 | $4,901 | $143,990 | $35,280 | $108,710 |
Source: Public Records
Map
Nearby Homes