
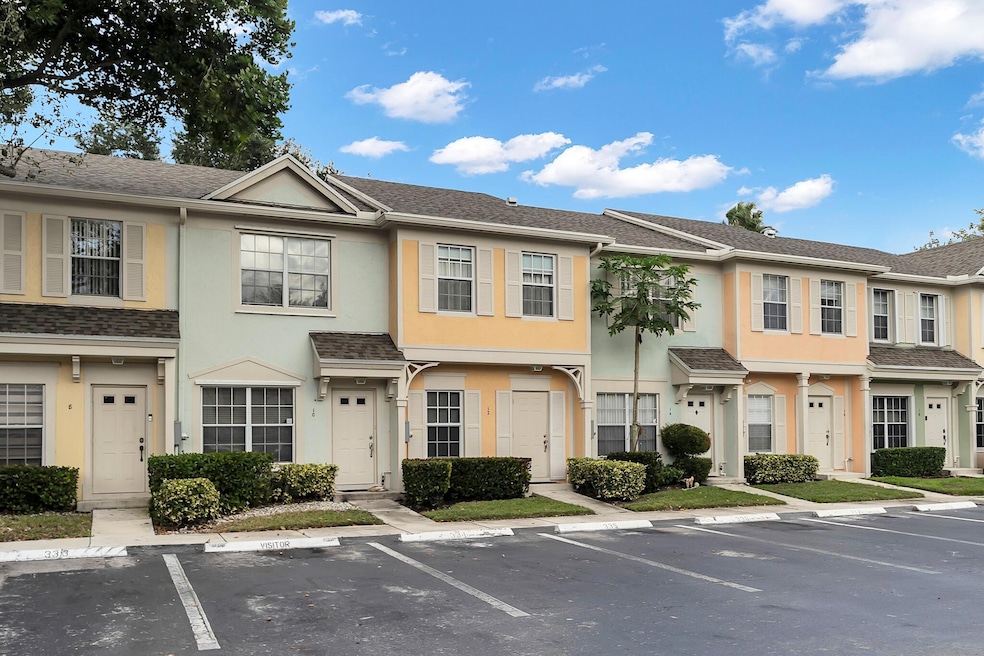
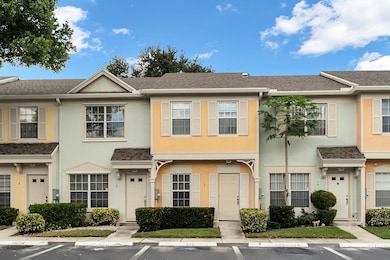
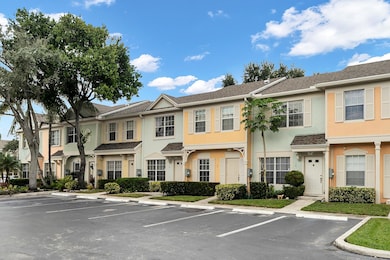
12 Fleming Ct Weston, FL 33326
Bonaventure NeighborhoodEstimated payment $3,054/month
Total Views
75,844
2
Beds
2.5
Baths
1,110
Sq Ft
$374
Price per Sq Ft
Highlights
- Fitness Center
- Clubhouse
- Screened Porch
- Eagle Point Elementary School Rated A
- Outdoor Living Area
- 3-minute walk to Bonaventure Park
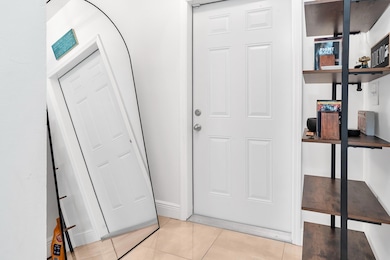
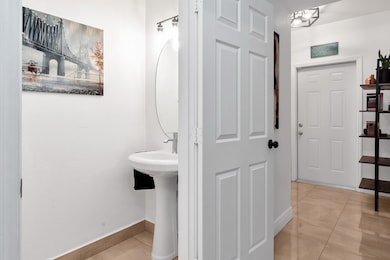
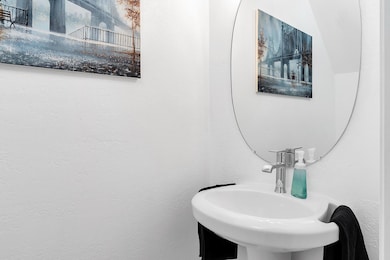
About This Home
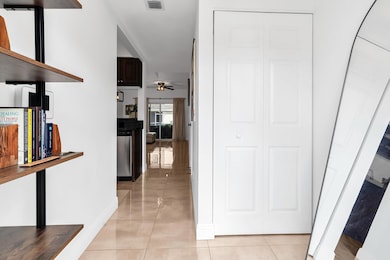
Beautifully maintained 2BR/2.5BA townhouse in the heart of Weston! Featuring all impact windows, doors, and sliders, a new roof (2023), and updated electrical panel. The open layout showcases gorgeous tile flooring throughout the living and kitchen areas. Bright, inviting, and move-in ready, this home offers comfort and peace of mind with quality upgrades throughout. Enjoy Weston's top-rated schools, parks, shopping, and dining just minutes away. Perfect for those seeking a modern, low-maintenance lifestyle in one of Broward's most desirable communities! Additional amenities include access to the Bonaventure Town Center, pool, gym and tennis courts. Don't wait, this property won't last!
Townhouse Details
Home Type
- Townhome
Est. Annual Taxes
- $6,549
Year Built
- Built in 1994
Lot Details
- 993 Sq Ft Lot
- West Facing Home
HOA Fees
- $273 Monthly HOA Fees
Interior Spaces
- 1,110 Sq Ft Home
- 2-Story Property
- Ceiling Fan
- Screened Porch
- Storage
- Vinyl Flooring
Kitchen
- Electric Range
- Microwave
- Dishwasher
- Disposal
Bedrooms and Bathrooms
- 2 Bedrooms
- Separate Shower in Primary Bathroom
Laundry
- Dryer
- Washer
Home Security
Parking
- Guest Parking
- Assigned Parking
Outdoor Features
- Patio
- Outdoor Living Area
Schools
- Eagle Point Elementary School
- Tequesta Trace Middle School
- Western High School
Utilities
- Central Heating and Cooling System
- Water Not Available
- Electric Water Heater
Listing and Financial Details
- Assessor Parcel Number 504005093350
Community Details
Overview
- Association fees include common areas, cable TV, ground maintenance
- Bonaventure Subdivision
Amenities
- Clubhouse
- Billiard Room
Recreation
- Tennis Courts
- Community Basketball Court
- Fitness Center
- Community Pool
Pet Policy
- Limit on the number of pets
Security
- Storm Windows
Map
Create a Home Valuation Report for This Property
The Home Valuation Report is an in-depth analysis detailing your home's value as well as a comparison with similar homes in the area
Home Values in the Area
Average Home Value in this Area
Tax History
| Year | Tax Paid | Tax Assessment Tax Assessment Total Assessment is a certain percentage of the fair market value that is determined by local assessors to be the total taxable value of land and additions on the property. | Land | Improvement |
|---|---|---|---|---|
| 2026 | $6,802 | $340,100 | -- | -- |
| 2025 | $6,549 | $331,160 | -- | -- |
| 2024 | $6,385 | $321,830 | $19,860 | $292,600 |
| 2023 | $6,385 | $312,460 | $19,860 | $292,600 |
| 2022 | $4,139 | $197,190 | $0 | $0 |
| 2021 | $4,021 | $191,450 | $0 | $0 |
| 2020 | $3,943 | $188,810 | $0 | $0 |
| 2019 | $3,908 | $184,570 | $0 | $0 |
| 2018 | $3,677 | $181,130 | $0 | $0 |
| 2017 | $3,518 | $177,410 | $0 | $0 |
| 2016 | $3,926 | $151,730 | $0 | $0 |
| 2015 | $3,806 | $137,940 | $0 | $0 |
| 2014 | $3,591 | $125,400 | $0 | $0 |
| 2013 | -- | $115,520 | $19,860 | $95,660 |
Source: Public Records
Property History
| Date | Event | Price | List to Sale | Price per Sq Ft |
|---|---|---|---|---|
| 10/25/2025 10/25/25 | For Sale | $415,000 | -- | $374 / Sq Ft |
Source: BeachesMLS (Greater Fort Lauderdale)
Purchase History
| Date | Type | Sale Price | Title Company |
|---|---|---|---|
| Warranty Deed | $325,000 | A Plus Title | |
| Quit Claim Deed | -- | Attorney | |
| Deed | $100 | -- | |
| Warranty Deed | $88,800 | -- | |
| Deed | $78,800 | -- |
Source: Public Records
Mortgage History
| Date | Status | Loan Amount | Loan Type |
|---|---|---|---|
| Open | $292,500 | New Conventional | |
| Previous Owner | $88,906 | FHA | |
| Previous Owner | $74,850 | No Value Available |
Source: Public Records
About the Listing Agent
Senior Real Estate Advisor
Adriana's Other Listings
-
$620,000 Sold Jan 05, 2026
- 3 Beds
- 2.5 Baths
- 1,710 Sq Ft
- 2500 E Las Olas Blvd
- Unit 802
- Fort Lauderdale, FL
Source: BeachesMLS (Greater Fort Lauderdale)
MLS Number: R11135317
APN: 50-40-05-09-3350
Disclaimer: Certain information contained herein is derived from information provided by parties other than Homes.com. All information provided is deemed reliable, but is not guaranteed to be accurate and should be independently verified.
![]() All listings featuring the BMLS logo are provided by Beaches MLS, Inc. This information is not verified for authenticity or accuracy and is not guaranteed. Copyright 2026 Beaches Multiple Listing Service, Inc. Information is provided exclusively for consumers' personal, non-commercial use and may not be used for any purpose other than to identify prospective properties consumers may be interested in purchasing.
All listings featuring the BMLS logo are provided by Beaches MLS, Inc. This information is not verified for authenticity or accuracy and is not guaranteed. Copyright 2026 Beaches Multiple Listing Service, Inc. Information is provided exclusively for consumers' personal, non-commercial use and may not be used for any purpose other than to identify prospective properties consumers may be interested in purchasing.
Nearby Homes
- 16769 Hemingway Dr Unit 243
- 60 Key West Ct Unit 60
- 16731 Hemingway Dr
- 491 Racquet Club Rd Unit 106
- 491 Racquet Club Rd Unit 107
- 491 Racquet Club Rd Unit 211
- 16768 Natures Way
- 16758 Natures Way
- 380 Racquet Club Rd Unit 204
- 380 Racquet Club Rd Unit 105
- 402 Lakeview Dr Unit 201
- 410 Lakeview Dr Unit 103
- 16773 Botaniko Dr S
- 16740 Botaniko Dr N
- 2 Simonton Cir
- 16753 Botaniko Dr S
- 561 Racquet Club Rd Unit 216
- 117 Danielle Ct
- 16709 Botaniko Dr N
- 567 Racquet Club Rd Unit 18
- 21 Fleming Ct
- 51 Whitehead Cir
- 70 Whitehead Cir
- 50 Key West Ct
- 20 Key West Ct
- 491 Racquet Club Rd Unit 211
- 543 Racquet Club Rd Unit 33
- 16721 Hemingway Dr
- 513 Racquet Club Rd
- 16690 Blatt Blvd Unit B
- 16690 Blatt Blvd Unit A
- 16697 Hemingway Dr Unit 16697
- 114 Danielle Ct
- 16699 Botaniko Dr N
- 16648 Hemingway Dr
- 403 Lakeview Dr Unit 106
- 357 Lakeview Dr Unit 201
- 369 Lakeview Dr Unit 101
- 436 Lakeview Dr Unit 205
- 16606 Greens Edge Cir Unit 87
Your Personal Tour Guide
Ask me questions while you tour the home.