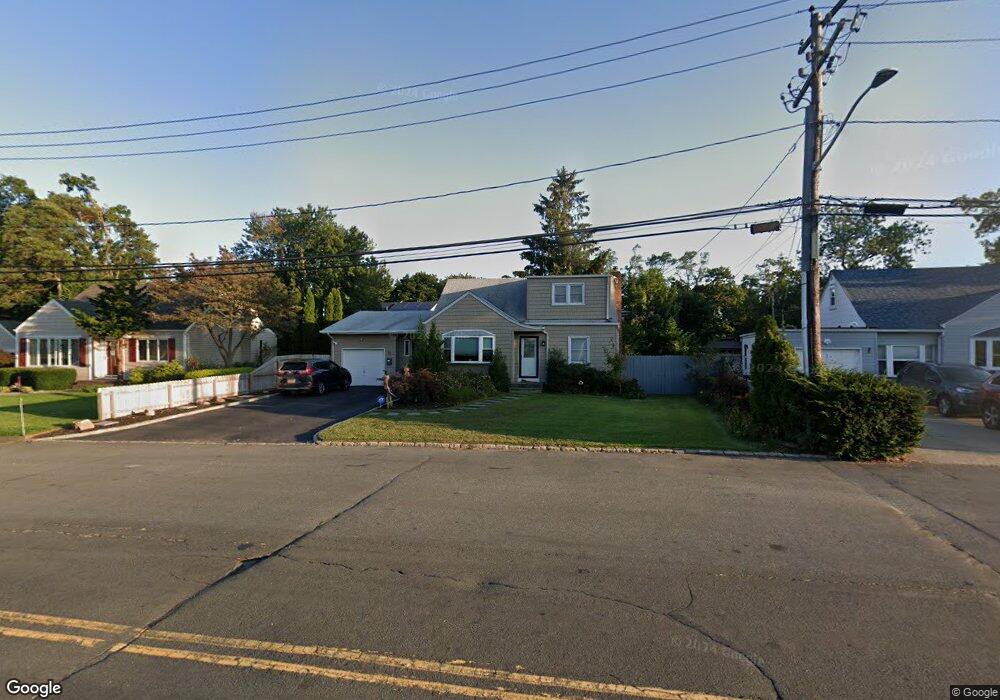
12 Foster Blvd Babylon, NY 11702
Estimated Value: $697,000 - $751,989
4
Beds
3
Baths
1,849
Sq Ft
$394/Sq Ft
Est. Value
About This Home
This home is located at 12 Foster Blvd, Babylon, NY 11702 and is currently estimated at $729,247, approximately $394 per square foot. 12 Foster Blvd is a home located in Suffolk County with nearby schools including Robert Moses Middle School, North Babylon High School, and South Bay Junior Academy.
Ownership History
Date
Name
Owned For
Owner Type
Purchase Details
Closed on
Mar 19, 2021
Sold by
Cruz Jeanette
Bought by
Osorio Iankel and Carrasco Iankel
Current Estimated Value
Home Financials for this Owner
Home Financials are based on the most recent Mortgage that was taken out on this home.
Original Mortgage
$425,000
Outstanding Balance
$382,261
Interest Rate
2.9%
Mortgage Type
Purchase Money Mortgage
Estimated Equity
$346,986
Purchase Details
Closed on
Dec 3, 2018
Sold by
Tanel Eric D and Tanel Michele J
Bought by
Cruz Jeanette
Home Financials for this Owner
Home Financials are based on the most recent Mortgage that was taken out on this home.
Original Mortgage
$412,392
Interest Rate
5.12%
Mortgage Type
FHA
Purchase Details
Closed on
Jul 30, 1998
Sold by
Zdanio Frank and Zdanio Claudia
Bought by
Tanel Eric D and Leo Michele J
Home Financials for this Owner
Home Financials are based on the most recent Mortgage that was taken out on this home.
Original Mortgage
$138,037
Interest Rate
6.94%
Mortgage Type
FHA
Create a Home Valuation Report for This Property
The Home Valuation Report is an in-depth analysis detailing your home's value as well as a comparison with similar homes in the area
Home Values in the Area
Average Home Value in this Area
Purchase History
| Date | Buyer | Sale Price | Title Company |
|---|---|---|---|
| Osorio Iankel | $500,000 | None Available | |
| Cruz Jeanette | $420,000 | -- | |
| Tanel Eric D | $155,000 | First American Title Ins Co |
Source: Public Records
Mortgage History
| Date | Status | Borrower | Loan Amount |
|---|---|---|---|
| Open | Osorio Iankel | $425,000 | |
| Previous Owner | Cruz Jeanette | $412,392 | |
| Previous Owner | Tanel Eric D | $138,037 |
Source: Public Records
Tax History
| Year | Tax Paid | Tax Assessment Tax Assessment Total Assessment is a certain percentage of the fair market value that is determined by local assessors to be the total taxable value of land and additions on the property. | Land | Improvement |
|---|---|---|---|---|
| 2024 | $13,478 | $3,970 | $360 | $3,610 |
| 2023 | $13,478 | $3,970 | $360 | $3,610 |
| 2022 | $12,137 | $3,970 | $360 | $3,610 |
| 2021 | $12,137 | $3,970 | $360 | $3,610 |
| 2020 | $12,369 | $3,970 | $360 | $3,610 |
| 2019 | $12,369 | $0 | $0 | $0 |
| 2018 | $10,850 | $3,970 | $360 | $3,610 |
| 2017 | $10,850 | $3,970 | $360 | $3,610 |
| 2016 | $10,791 | $3,970 | $360 | $3,610 |
| 2015 | -- | $3,970 | $360 | $3,610 |
| 2014 | -- | $3,970 | $360 | $3,610 |
Source: Public Records
Map
Nearby Homes
- 7 Lico Place
- 109 Vesper Ct
- 64 Ketewamoke Ave
- 1 Freedom Ct
- 3 Avelaine Ct
- 967 Sunrise Hwy
- 30 Jenkins Ave
- 112 Edmunton Dr Unit C4
- 43 Springwood Dr
- 192 Edmunton Dr Unit D1
- 9 Hamilton Ave
- 141 Edmunton Dr Unit G 18
- 42 Springwood Dr
- 51 Edmunton Dr Unit F17
- 294 Edmunton Dr Unit K18
- 111 Edmunton Dr Unit G4
- 326 Edmunton Dr Unit L-7
- 265 Edmunton Dr Unit I-12
- 285 Edmunton Dr Unit 16
- 205 Edmunton Dr Unit H17
- 16 Foster Blvd
- 8 Foster Blvd
- 11 Oakrest Ln
- 15 Oakrest Ln
- 7 Oakrest Ln
- 20 Foster Blvd
- 4 Foster Blvd
- 19 Oakrest Ln
- 643 Deer Park Ave
- 643 Deer Park Ave
- 24 Foster Blvd
- 23 Oakrest Ln
- 174 Foster Blvd
- 35 Village Line Rd
- 39 Village Line Rd
- 29 Village Line Rd
- 33 Hinton Ave
- 28 Foster Blvd
- 27 Oakrest Ln
- 656 Deer Park Ave
Your Personal Tour Guide
Ask me questions while you tour the home.