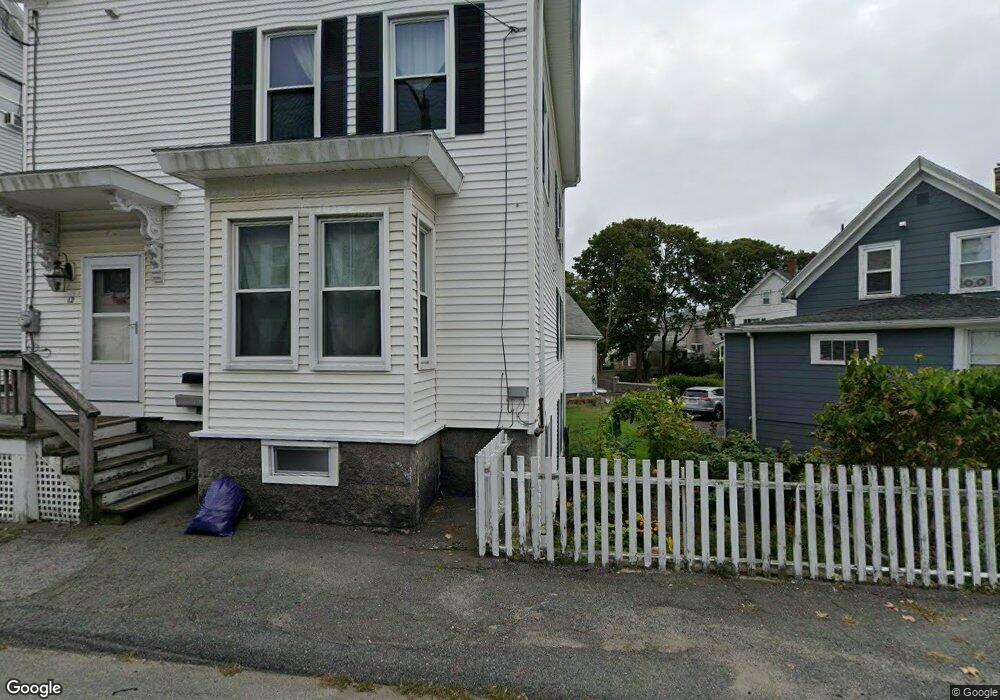
12 Foster St Gloucester, MA 01930
Central Gloucester NeighborhoodEstimated Value: $483,000 - $661,000
4
Beds
2
Baths
1,637
Sq Ft
$359/Sq Ft
Est. Value
About This Home
This home is located at 12 Foster St, Gloucester, MA 01930 and is currently estimated at $587,673, approximately $358 per square foot. 12 Foster St is a home located in Essex County with nearby schools including Beeman Memorial, Ralph B O'maley Middle School, and Gloucester High School.
Ownership History
Date
Name
Owned For
Owner Type
Purchase Details
Closed on
Jun 16, 2016
Sold by
Beneficial Mass Inc
Bought by
Castelluccio John and Castelluccio Katherine
Current Estimated Value
Home Financials for this Owner
Home Financials are based on the most recent Mortgage that was taken out on this home.
Original Mortgage
$226,889
Outstanding Balance
$180,813
Interest Rate
3.61%
Mortgage Type
FHA
Estimated Equity
$406,860
Purchase Details
Closed on
Aug 14, 2015
Sold by
Dench Donald J
Bought by
Beneficial Mass Inc
Purchase Details
Closed on
Oct 30, 1998
Sold by
12 Foster Street Rt
Bought by
Dench Donald J and Dench Dawn C
Home Financials for this Owner
Home Financials are based on the most recent Mortgage that was taken out on this home.
Original Mortgage
$8,500
Interest Rate
6.68%
Create a Home Valuation Report for This Property
The Home Valuation Report is an in-depth analysis detailing your home's value as well as a comparison with similar homes in the area
Home Values in the Area
Average Home Value in this Area
Purchase History
| Date | Buyer | Sale Price | Title Company |
|---|---|---|---|
| Castelluccio John | $174,814 | -- | |
| Beneficial Mass Inc | $172,840 | -- | |
| Dench Donald J | $130,000 | -- |
Source: Public Records
Mortgage History
| Date | Status | Borrower | Loan Amount |
|---|---|---|---|
| Open | Castelluccio John | $226,889 | |
| Previous Owner | Dench Donald J | $166,000 | |
| Previous Owner | Dench Donald J | $19,700 | |
| Previous Owner | Dench Donald J | $120,000 | |
| Previous Owner | Dench Donald J | $8,500 |
Source: Public Records
Tax History Compared to Growth
Tax History
| Year | Tax Paid | Tax Assessment Tax Assessment Total Assessment is a certain percentage of the fair market value that is determined by local assessors to be the total taxable value of land and additions on the property. | Land | Improvement |
|---|---|---|---|---|
| 2025 | $4,978 | $512,100 | $133,300 | $378,800 |
| 2024 | $4,920 | $505,700 | $126,900 | $378,800 |
| 2023 | $4,702 | $444,000 | $113,300 | $330,700 |
| 2022 | $4,551 | $388,000 | $98,600 | $289,400 |
| 2021 | $4,390 | $352,900 | $89,600 | $263,300 |
| 2020 | $4,334 | $351,500 | $89,600 | $261,900 |
| 2019 | $4,104 | $323,400 | $89,600 | $233,800 |
| 2018 | $3,926 | $303,600 | $89,600 | $214,000 |
| 2017 | $3,750 | $284,300 | $80,700 | $203,600 |
| 2016 | $3,574 | $262,600 | $80,700 | $181,900 |
| 2015 | $3,391 | $248,400 | $80,700 | $167,700 |
Source: Public Records
Map
Nearby Homes
- 8 Summer St Unit 103
- 5 Washington Square
- 33 Middle St
- 35 Middle St Unit 4
- 15 Harvard St
- 33 Maplewood Ave Unit 21
- 90 Middle St Unit L
- 119 Pleasant St
- 196 Washington St
- 191 Main St Unit 2B
- 191 Main St Unit 3
- 191 Main St Unit 2A
- 16 Cleveland Place Unit 11
- 40 Sargent St
- 78 Grove St
- 4 Mount Vernon St
- 19 Mystic Ave
- 160 Prospect St Unit 3
- 22 Taylor St Unit 1
- 65 Poplar St