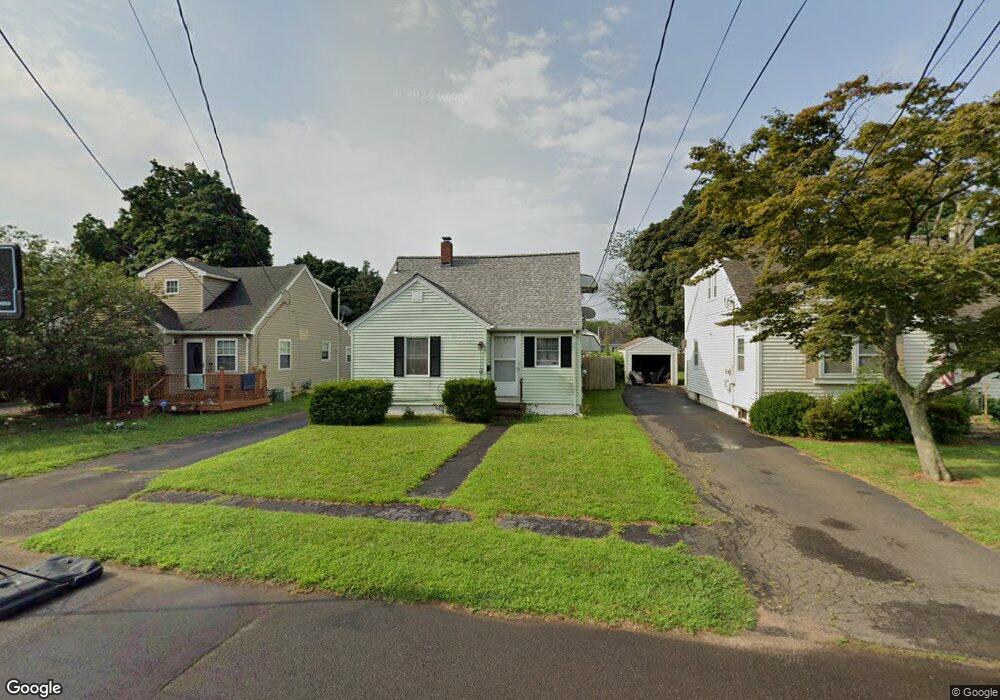
12 Francis St East Haven, CT 06512
Estimated Value: $328,598 - $362,000
3
Beds
1
Bath
1,155
Sq Ft
$298/Sq Ft
Est. Value
About This Home
This home is located at 12 Francis St, East Haven, CT 06512 and is currently estimated at $344,400, approximately $298 per square foot. 12 Francis St is a home located in New Haven County with nearby schools including East Haven High School, Cold Spring School, and Pathway School.
Ownership History
Date
Name
Owned For
Owner Type
Purchase Details
Closed on
Sep 23, 2019
Sold by
Lundborg Carl and Lundborg Karen
Bought by
Ibragimova Dilnoza and Wangaard Elliott
Current Estimated Value
Home Financials for this Owner
Home Financials are based on the most recent Mortgage that was taken out on this home.
Original Mortgage
$348,650
Outstanding Balance
$305,390
Interest Rate
3.6%
Mortgage Type
New Conventional
Estimated Equity
$39,010
Purchase Details
Closed on
Aug 29, 2013
Sold by
Onorato Pasquale A
Bought by
Onorato Pasquale A and Onorato Tracey A
Purchase Details
Closed on
Jul 8, 2005
Sold by
Eaton Row Llc
Bought by
Ellison Daryl L and Ellison Antonia S
Home Financials for this Owner
Home Financials are based on the most recent Mortgage that was taken out on this home.
Original Mortgage
$131,200
Interest Rate
5.71%
Create a Home Valuation Report for This Property
The Home Valuation Report is an in-depth analysis detailing your home's value as well as a comparison with similar homes in the area
Home Values in the Area
Average Home Value in this Area
Purchase History
| Date | Buyer | Sale Price | Title Company |
|---|---|---|---|
| Ibragimova Dilnoza | $367,000 | -- | |
| Onorato Pasquale A | -- | -- | |
| Ellison Daryl L | $143,000 | -- | |
| Onorato Pasquale A | -- | -- | |
| Ellison Daryl L | $143,000 | -- |
Source: Public Records
Mortgage History
| Date | Status | Borrower | Loan Amount |
|---|---|---|---|
| Open | Ibragimova Dilnoza | $348,650 | |
| Previous Owner | Ellison Daryl L | $131,200 |
Source: Public Records
Tax History Compared to Growth
Tax History
| Year | Tax Paid | Tax Assessment Tax Assessment Total Assessment is a certain percentage of the fair market value that is determined by local assessors to be the total taxable value of land and additions on the property. | Land | Improvement |
|---|---|---|---|---|
| 2025 | $4,529 | $135,450 | $47,110 | $88,340 |
| 2024 | $4,529 | $135,450 | $47,110 | $88,340 |
| 2023 | $4,226 | $135,450 | $47,110 | $88,340 |
| 2022 | $4,226 | $135,450 | $47,110 | $88,340 |
| 2021 | $3,766 | $109,960 | $45,050 | $64,910 |
| 2020 | $3,766 | $109,960 | $45,050 | $64,910 |
| 2019 | $3,565 | $109,960 | $45,050 | $64,910 |
| 2018 | $3,568 | $109,960 | $45,050 | $64,910 |
| 2017 | $3,469 | $109,960 | $45,050 | $64,910 |
| 2016 | $3,569 | $113,120 | $45,040 | $68,080 |
| 2015 | $3,569 | $113,120 | $45,040 | $68,080 |
| 2014 | $3,625 | $113,120 | $45,040 | $68,080 |
Source: Public Records
Map
Nearby Homes
- 458 Thompson Ave
- 364 Main St Unit 47
- 14 Gerrish Ave
- 31 Forest St
- 50 Robert Dr
- 17 Guilford Ct
- 71 High St
- 47 Guilford Ct
- 133 Charter Oak Ave
- 4 Laura Ln
- 93 Kimberly Ave
- 34 Hughes St
- 18 Lenox St
- 366 Burr St
- 66 Elizabeth Ann Dr
- 103 Saltonstall Pkwy
- 62 Huntington Rd Unit 7
- 34 River St
- 20 Weber St
- 237 N High St