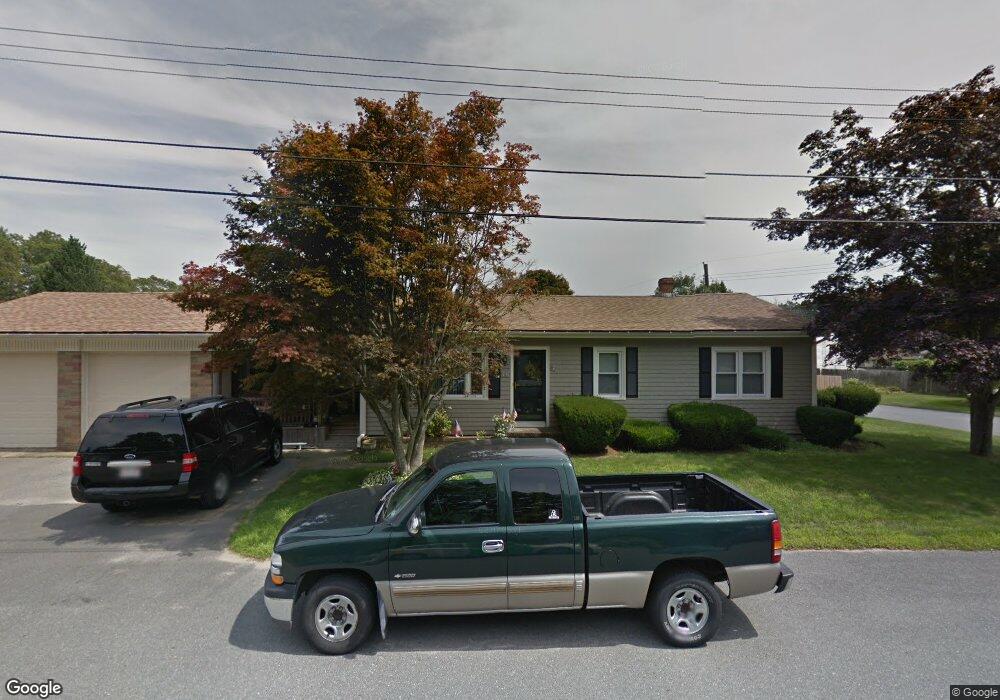
12 Frank St Acushnet, MA 02743
Upper Acushnet NeighborhoodEstimated Value: $427,000 - $531,000
--
Bed
2
Baths
1,340
Sq Ft
$350/Sq Ft
Est. Value
About This Home
This home is located at 12 Frank St, Acushnet, MA 02743 and is currently estimated at $469,619, approximately $350 per square foot. 12 Frank St is a home located in Bristol County with nearby schools including Acushnet Elementary School, Albert F Ford Middle School, and Alma Del Mar Charter School.
Ownership History
Date
Name
Owned For
Owner Type
Purchase Details
Closed on
Nov 7, 1997
Sold by
Sylvia David P
Bought by
Howell Kevin E and Howell Nicole
Current Estimated Value
Purchase Details
Closed on
Oct 8, 1996
Sold by
Lotax Inc
Bought by
Sylvia David P
Purchase Details
Closed on
Jun 13, 1988
Sold by
Cormier Leo E
Bought by
Demello Edward
Create a Home Valuation Report for This Property
The Home Valuation Report is an in-depth analysis detailing your home's value as well as a comparison with similar homes in the area
Home Values in the Area
Average Home Value in this Area
Purchase History
| Date | Buyer | Sale Price | Title Company |
|---|---|---|---|
| Howell Kevin E | $140,000 | -- | |
| Sylvia David P | $110,000 | -- | |
| Lotax Inc | $68,000 | -- | |
| Demello Edward | $130,000 | -- |
Source: Public Records
Mortgage History
| Date | Status | Borrower | Loan Amount |
|---|---|---|---|
| Open | Demello Edward | $179,000 | |
| Closed | Demello Edward | $153,000 |
Source: Public Records
Tax History
| Year | Tax Paid | Tax Assessment Tax Assessment Total Assessment is a certain percentage of the fair market value that is determined by local assessors to be the total taxable value of land and additions on the property. | Land | Improvement |
|---|---|---|---|---|
| 2025 | $38 | $352,600 | $120,400 | $232,200 |
| 2024 | $3,680 | $322,500 | $114,000 | $208,500 |
| 2023 | $3,570 | $297,500 | $103,500 | $194,000 |
| 2022 | $3,559 | $268,200 | $97,100 | $171,100 |
| 2021 | $3,433 | $248,200 | $97,100 | $151,100 |
| 2020 | $3,372 | $241,900 | $90,800 | $151,100 |
| 2019 | $3,256 | $229,600 | $86,600 | $143,000 |
| 2018 | $3,369 | $218,800 | $86,600 | $132,200 |
| 2017 | $3,054 | $211,500 | $86,600 | $124,900 |
| 2016 | $2,977 | $204,900 | $86,600 | $118,300 |
| 2015 | $2,830 | $198,200 | $86,600 | $111,600 |
Source: Public Records
Map
Nearby Homes
Your Personal Tour Guide
Ask me questions while you tour the home.