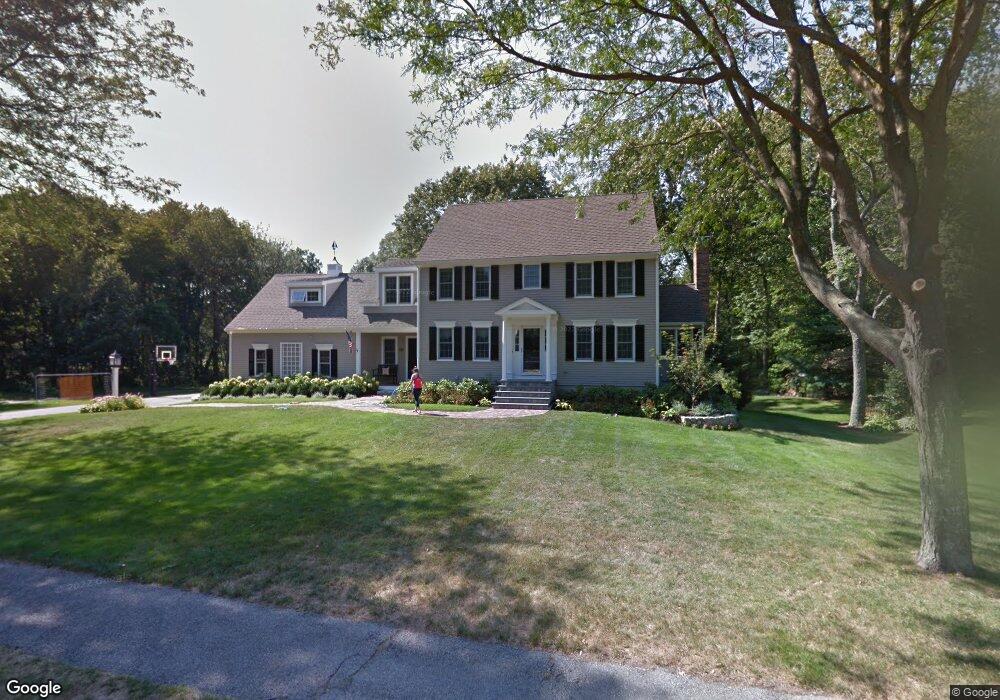
12 Franklin Rodgers Rd Hingham, MA 02043
Estimated Value: $1,897,321 - $2,434,000
4
Beds
4
Baths
3,000
Sq Ft
$713/Sq Ft
Est. Value
About This Home
This home is located at 12 Franklin Rodgers Rd, Hingham, MA 02043 and is currently estimated at $2,139,080, approximately $713 per square foot. 12 Franklin Rodgers Rd is a home located in Plymouth County with nearby schools including Plymouth River Elementary School, Hingham Middle School, and Hingham High School.
Ownership History
Date
Name
Owned For
Owner Type
Purchase Details
Closed on
Mar 30, 2015
Sold by
Chiappinelli Peter and Chiappinelli Cheryl A
Bought by
Cheryl A Chiappinelli
Current Estimated Value
Purchase Details
Closed on
Apr 18, 2007
Sold by
Bailey David R and Bailey Maura M
Bought by
Chiappinelli Peter and Chiappinelli Cheryl A
Purchase Details
Closed on
Aug 10, 1993
Sold by
Conservatory Park Inc
Bought by
Bailey David R and Bailey Maura M
Create a Home Valuation Report for This Property
The Home Valuation Report is an in-depth analysis detailing your home's value as well as a comparison with similar homes in the area
Purchase History
| Date | Buyer | Sale Price | Title Company |
|---|---|---|---|
| Cheryl A Chiappinelli | -- | -- | |
| Chiappinelli Peter | $1,141,700 | -- | |
| Bailey David R | $130,000 | -- |
Source: Public Records
Mortgage History
| Date | Status | Borrower | Loan Amount |
|---|---|---|---|
| Previous Owner | Bailey David R | $260,000 | |
| Previous Owner | Bailey David R | $177,000 |
Source: Public Records
Tax History
| Year | Tax Paid | Tax Assessment Tax Assessment Total Assessment is a certain percentage of the fair market value that is determined by local assessors to be the total taxable value of land and additions on the property. | Land | Improvement |
|---|---|---|---|---|
| 2025 | $17,549 | $1,641,600 | $657,200 | $984,400 |
| 2024 | $16,802 | $1,548,600 | $657,200 | $891,400 |
| 2023 | $14,694 | $1,469,400 | $657,200 | $812,200 |
| 2022 | $14,323 | $1,239,000 | $586,800 | $652,200 |
| 2021 | $13,773 | $1,167,200 | $564,200 | $603,000 |
| 2020 | $13,458 | $1,167,200 | $564,200 | $603,000 |
| 2019 | $13,341 | $1,129,600 | $564,200 | $565,400 |
| 2018 | $13,295 | $1,129,600 | $564,200 | $565,400 |
| 2017 | $9,166 | $1,083,600 | $583,300 | $500,300 |
| 2016 | $13,189 | $1,056,000 | $555,700 | $500,300 |
| 2015 | $12,900 | $1,029,500 | $529,200 | $500,300 |
Source: Public Records
Map
Nearby Homes
- 156 Fort Hill St
- 6 Adams Ct
- 1 Squirrel Hill Ln
- 6 Brewer Way
- 1206 Tuckers Ln Unit 1206
- 225 South St Unit 1
- 7 Lewis Ct
- 21 Hersey St
- 425 East St
- 30 Puritan Rd
- 43 Park View Dr
- 92 Doris Dr
- 109 Merryknoll Rd
- 5 Endicott St
- 19 Lantern Ln
- 2 Langlee Rd
- 70 Holmes Ave
- 43 Filomena St
- 151 Stayner Dr Unit 151
- 1 Hemlock Rd
- 14 Franklin Rodgers Rd
- 15 Franklin Rodgers Rd
- 3 John Hazlitt Ln
- 16 Franklin Rodgers Rd
- 4 John Hazlitt Ln
- 10 Franklin Rodgers Rd
- 8 Franklin Rodgers Rd
- 17 Franklin Rodgers Rd
- 6 Franklin Rodgers Rd
- 18 Franklin Rodgers Rd
- 9 Franklin Rodgers Rd
- 19 Franklin Rodgers Rd
- 7 Franklin Rodgers Rd
- 4 Franklin Rodgers Rd
- 8 Isaac Sprague Dr
- 6 Isaac Sprague Dr
- 1 John Hazlitt Ln
- 20 Franklin Rodgers Rd
- 5 Franklin Rodgers Rd
- 21 Franklin Rodgers Rd
Your Personal Tour Guide
Ask me questions while you tour the home.