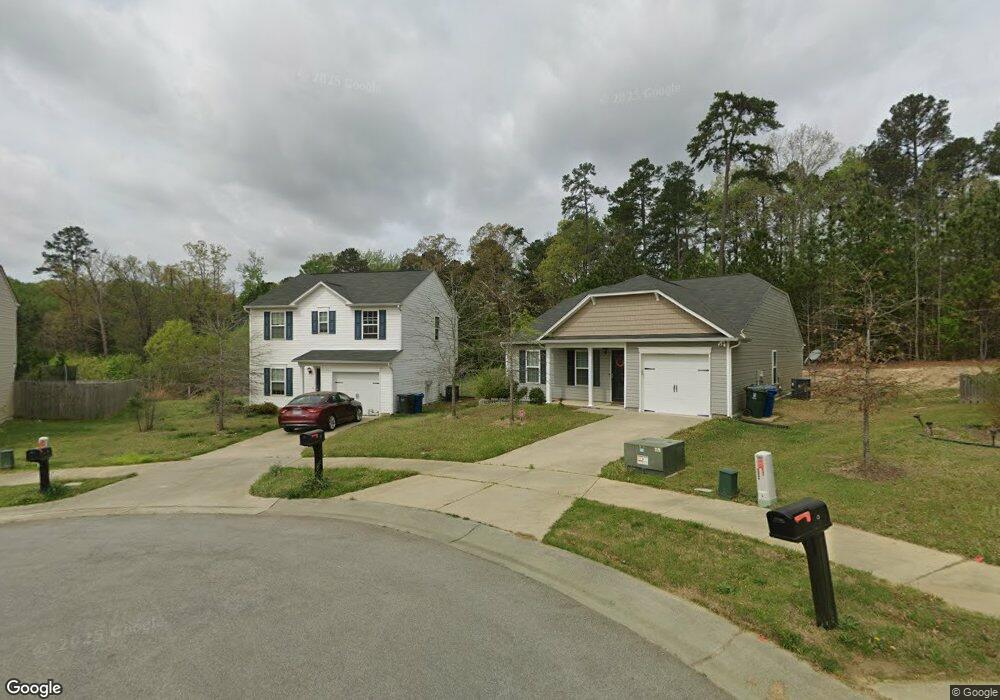
12 Frinton Place Durham, NC 27704
Northeast Durham NeighborhoodEstimated Value: $303,000 - $318,849
3
Beds
3
Baths
1,437
Sq Ft
$216/Sq Ft
Est. Value
About This Home
This home is located at 12 Frinton Place, Durham, NC 27704 and is currently estimated at $310,962, approximately $216 per square foot. 12 Frinton Place is a home located in Durham County with nearby schools including Merrick-Moore Elementary School, John W Neal Middle School, and Southern School of Energy & Sustainability.
Ownership History
Date
Name
Owned For
Owner Type
Purchase Details
Closed on
Jul 19, 2017
Sold by
Southern James M and Southern Lisa M
Bought by
Southern Family Property Holding Inc
Current Estimated Value
Purchase Details
Closed on
Mar 28, 2017
Sold by
Wjh Llc
Bought by
Southern James M and Southern Lisa M
Home Financials for this Owner
Home Financials are based on the most recent Mortgage that was taken out on this home.
Original Mortgage
$205,493
Interest Rate
4.1%
Mortgage Type
Purchase Money Mortgage
Purchase Details
Closed on
Oct 20, 2016
Sold by
East Geer Ventures Llc
Bought by
Wade Jurney Homes Inc
Purchase Details
Closed on
Sep 12, 2006
Sold by
Centex Homes
Bought by
Ellis Patrick Neal and Ellis Jaime Ballard
Home Financials for this Owner
Home Financials are based on the most recent Mortgage that was taken out on this home.
Original Mortgage
$293,000
Interest Rate
6.67%
Mortgage Type
Purchase Money Mortgage
Create a Home Valuation Report for This Property
The Home Valuation Report is an in-depth analysis detailing your home's value as well as a comparison with similar homes in the area
Home Values in the Area
Average Home Value in this Area
Purchase History
| Date | Buyer | Sale Price | Title Company |
|---|---|---|---|
| Southern Family Property Holding Inc | -- | None Available | |
| Southern James M | $129,000 | -- | |
| Wade Jurney Homes Inc | $231,000 | -- | |
| Ellis Patrick Neal | $366,500 | None Available |
Source: Public Records
Mortgage History
| Date | Status | Borrower | Loan Amount |
|---|---|---|---|
| Previous Owner | Southern James M | $205,493 | |
| Previous Owner | Ellis Patrick Neal | $293,000 |
Source: Public Records
Tax History Compared to Growth
Tax History
| Year | Tax Paid | Tax Assessment Tax Assessment Total Assessment is a certain percentage of the fair market value that is determined by local assessors to be the total taxable value of land and additions on the property. | Land | Improvement |
|---|---|---|---|---|
| 2025 | $1,970 | $333,193 | $78,125 | $255,068 |
| 2024 | $1,970 | $141,224 | $24,900 | $116,324 |
| 2023 | $1,850 | $141,224 | $24,900 | $116,324 |
| 2022 | $1,808 | $141,224 | $24,900 | $116,324 |
| 2021 | $1,799 | $141,224 | $24,900 | $116,324 |
| 2020 | $1,757 | $141,224 | $24,900 | $116,324 |
| 2019 | $1,757 | $141,224 | $24,900 | $116,324 |
| 2018 | $1,746 | $128,688 | $28,012 | $100,676 |
| 2017 | $75 | $5,602 | $5,602 | $0 |
| 2016 | $73 | $5,602 | $5,602 | $0 |
| 2015 | $92 | $6,670 | $6,670 | $0 |
| 2014 | $92 | $6,670 | $6,670 | $0 |
Source: Public Records
Map
Nearby Homes
- 1615 Great Bend Dr
- 2027 Buffalo Way
- 2121 Lime St
- 2206 E Club Blvd
- 1821 E Geer St
- 18 Syracuse Place
- 1823 E Geer St
- 2238 Crestwood Ridge Dr
- 2321 Overland Dr
- 1515 Milan St
- 1519 Milan St
- 5 Sue Ann Ct
- 1509 Logan St
- 1113 Midland Terrace
- 2013 Rabbitbrush St
- 2210 Rabbitbrush St
- 2003 Rabbitbrush St
- 2212 Rabbitbrush St
- 2206 Rabbitbrush St
- 2214 Rabbitbrush St
- 11 Frinton Place
- 10 Frinton Place
- 8 Frinton Place
- 6 Frinton Place
- 1914 Buffalo Way
- 4 Frinton Place
- 1916 Buffalo Way
- 1912 Buffalo Way
- 1918 Buffalo Way
- 1910 Buffalo Way
- 1920 Buffalo Way
- 1908 Buffalo Way
- 2 Frinton Place
- 1922 Buffalo Way
- 1408 Glenbrittle Dr
- 1906 Buffalo Way
- 1406 Glenbrittle Dr
- 1924 Buffalo Way
- 1904 Buffalo Way
- 1917 Buffalo Way