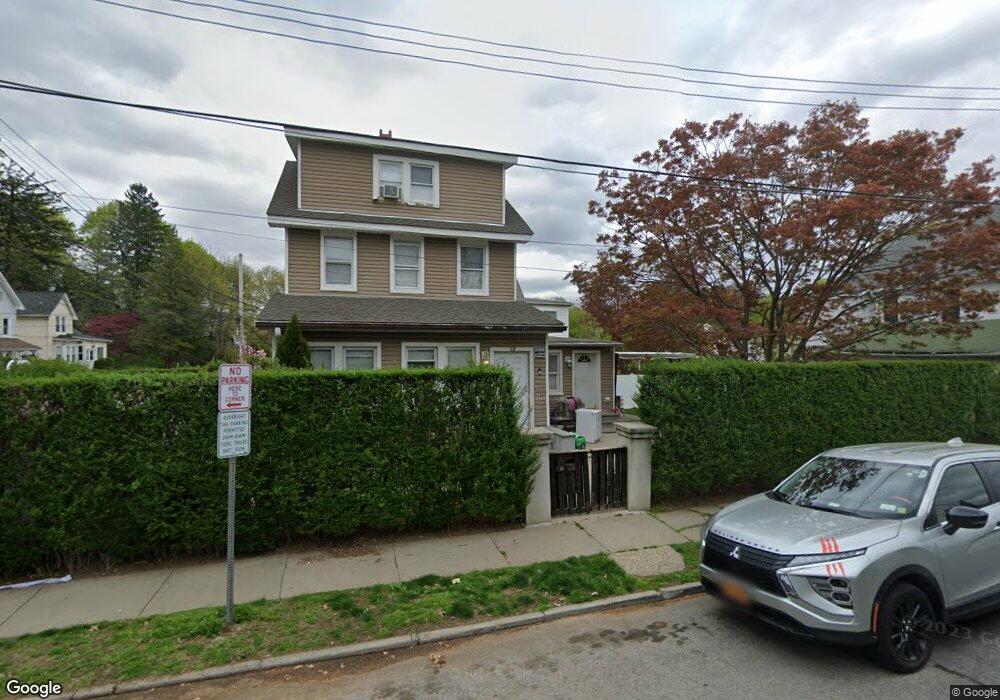
12 Garden St Ossining, NY 10562
Estimated Value: $646,000 - $739,000
2
Beds
3
Baths
1,989
Sq Ft
$351/Sq Ft
Est. Value
About This Home
This home is located at 12 Garden St, Ossining, NY 10562 and is currently estimated at $697,694, approximately $350 per square foot. 12 Garden St is a home located in Westchester County with nearby schools including Park School, Roosevelt Elementary School, and Claremont School.
Ownership History
Date
Name
Owned For
Owner Type
Purchase Details
Closed on
Aug 7, 2015
Sold by
Smith David and Smith Karin
Bought by
Smith David and Smith Karin
Current Estimated Value
Home Financials for this Owner
Home Financials are based on the most recent Mortgage that was taken out on this home.
Original Mortgage
$356,000
Outstanding Balance
$280,372
Interest Rate
4.07%
Mortgage Type
New Conventional
Estimated Equity
$417,322
Purchase Details
Closed on
Jul 29, 2013
Sold by
Disisto August and Disisto Angela
Bought by
Smith David and Smith Karin
Home Financials for this Owner
Home Financials are based on the most recent Mortgage that was taken out on this home.
Original Mortgage
$324,000
Interest Rate
3.95%
Mortgage Type
New Conventional
Create a Home Valuation Report for This Property
The Home Valuation Report is an in-depth analysis detailing your home's value as well as a comparison with similar homes in the area
Home Values in the Area
Average Home Value in this Area
Purchase History
| Date | Buyer | Sale Price | Title Company |
|---|---|---|---|
| Smith David | -- | Attorney | |
| Smith David | $405,000 | The Judicial Title Insurance |
Source: Public Records
Mortgage History
| Date | Status | Borrower | Loan Amount |
|---|---|---|---|
| Open | Smith David | $356,000 | |
| Closed | Smith David | $324,000 |
Source: Public Records
Tax History
| Year | Tax Paid | Tax Assessment Tax Assessment Total Assessment is a certain percentage of the fair market value that is determined by local assessors to be the total taxable value of land and additions on the property. | Land | Improvement |
|---|---|---|---|---|
| 2024 | $14,367 | $584,100 | $179,100 | $405,000 |
| 2023 | $13,585 | $546,300 | $179,100 | $367,200 |
| 2022 | $13,606 | $488,600 | $179,100 | $309,500 |
| 2021 | $13,725 | $444,200 | $179,100 | $265,100 |
| 2020 | $13,388 | $444,200 | $179,100 | $265,100 |
| 2019 | $13,458 | $425,400 | $179,100 | $246,300 |
| 2018 | $13,385 | $425,400 | $179,100 | $246,300 |
| 2017 | $0 | $421,300 | $179,100 | $242,200 |
| 2016 | $153,619 | $409,100 | $179,100 | $230,000 |
| 2015 | -- | $22,900 | $4,000 | $18,900 |
| 2014 | -- | $22,900 | $4,000 | $18,900 |
| 2013 | -- | $19,045 | $4,000 | $15,045 |
Source: Public Records
Map
Nearby Homes
- 38 Terrace Ave
- 15 Ferris Place
- 132 Croton Ave
- 135 N Highland Ave
- 143 N Highland Ave
- 39 Ann St
- 0 van Wyck St Unit KEY834077
- 90 Broadway
- 59 Watson Ave
- 135 Main St Unit 203
- 1C Calam Ave
- 7 Hawkes Ave
- 16 Maple Place
- 1 Noel Dr
- 2 N Water St Unit 1A
- 63 Cedar Ln
- 1 Edward St
- 48 Pershing Ave
- 42 Campwoods Grounds
- 131 Spring St
Your Personal Tour Guide
Ask me questions while you tour the home.