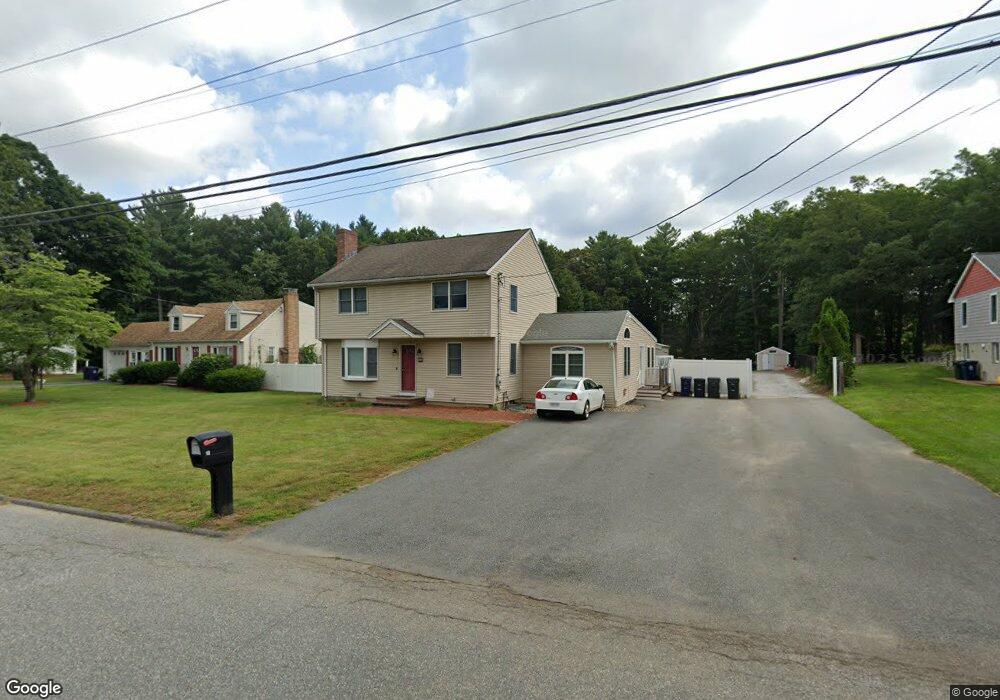
12 Gowing Rd Wilmington, MA 01887
Estimated Value: $785,000 - $928,000
3
Beds
2
Baths
2,752
Sq Ft
$313/Sq Ft
Est. Value
About This Home
This home is located at 12 Gowing Rd, Wilmington, MA 01887 and is currently estimated at $861,597, approximately $313 per square foot. 12 Gowing Rd is a home located in Middlesex County with nearby schools including Wilmington Middle School, Wilmington High School, and N Reading Knowledge Beginnings.
Ownership History
Date
Name
Owned For
Owner Type
Purchase Details
Closed on
Sep 17, 2021
Sold by
Cooney Ann P
Bought by
Cooney Brian T
Current Estimated Value
Home Financials for this Owner
Home Financials are based on the most recent Mortgage that was taken out on this home.
Original Mortgage
$350,000
Outstanding Balance
$317,294
Interest Rate
2.7%
Mortgage Type
Purchase Money Mortgage
Estimated Equity
$544,303
Purchase Details
Closed on
Jan 25, 2019
Sold by
Cooney Brian T and Cooney Ann P
Bought by
Cooney Ann P
Purchase Details
Closed on
Oct 27, 1995
Sold by
Hauray Jacques J and Hauray Christine
Bought by
Cooney Brian T
Purchase Details
Closed on
Apr 27, 1988
Sold by
Favero Roger A
Bought by
Huray Jacques J
Create a Home Valuation Report for This Property
The Home Valuation Report is an in-depth analysis detailing your home's value as well as a comparison with similar homes in the area
Home Values in the Area
Average Home Value in this Area
Purchase History
| Date | Buyer | Sale Price | Title Company |
|---|---|---|---|
| Cooney Brian T | $625,000 | None Available | |
| Cooney Ann P | -- | -- | |
| Cooney Brian T | $167,500 | -- | |
| Huray Jacques J | $143,000 | -- |
Source: Public Records
Mortgage History
| Date | Status | Borrower | Loan Amount |
|---|---|---|---|
| Open | Cooney Brian T | $350,000 | |
| Previous Owner | Huray Jacques J | $25,000 | |
| Previous Owner | Huray Jacques J | $311,000 |
Source: Public Records
Tax History Compared to Growth
Tax History
| Year | Tax Paid | Tax Assessment Tax Assessment Total Assessment is a certain percentage of the fair market value that is determined by local assessors to be the total taxable value of land and additions on the property. | Land | Improvement |
|---|---|---|---|---|
| 2025 | $9,258 | $808,600 | $322,400 | $486,200 |
| 2024 | $9,087 | $795,000 | $322,400 | $472,600 |
| 2023 | $8,514 | $713,100 | $293,000 | $420,100 |
| 2022 | $8,085 | $620,500 | $244,200 | $376,300 |
| 2021 | $8,102 | $585,400 | $221,900 | $363,500 |
| 2020 | $7,910 | $582,500 | $221,900 | $360,600 |
| 2019 | $7,754 | $563,900 | $211,400 | $352,500 |
| 2018 | $7,656 | $531,300 | $201,300 | $330,000 |
| 2017 | $7,575 | $524,200 | $201,300 | $322,900 |
| 2016 | $7,082 | $484,100 | $191,600 | $292,500 |
| 2015 | $7,077 | $492,500 | $191,600 | $300,900 |
| 2014 | $6,599 | $463,400 | $182,400 | $281,000 |
Source: Public Records
Map
Nearby Homes
- 1 Evans Dr
- 7 W Village Dr
- 5 Flynn Way
- 12 Lockwood Rd
- 220 Martins Landing Unit 309
- 260 Martins Landing Unit 508
- 260 Martins Landing Unit 103
- 300 Martins Landing Unit 107
- 320 Martins Landing Unit 108
- 320 Martins Landing Unit 109
- 320 Martins Landing Unit 110
- 320 Martins Landing Unit 303
- 320 Martins Landing Unit 102
- 320 Martins Landing Unit 103
- 320 Martins Landing Unit 2410
- 320 Martins Landing Unit 403
- 320 Martins Landing Unit 2201
- 320 Martins Landing Unit 112
- 320 Martins Landing Unit 206
- 320 Martins Landing Unit 2307