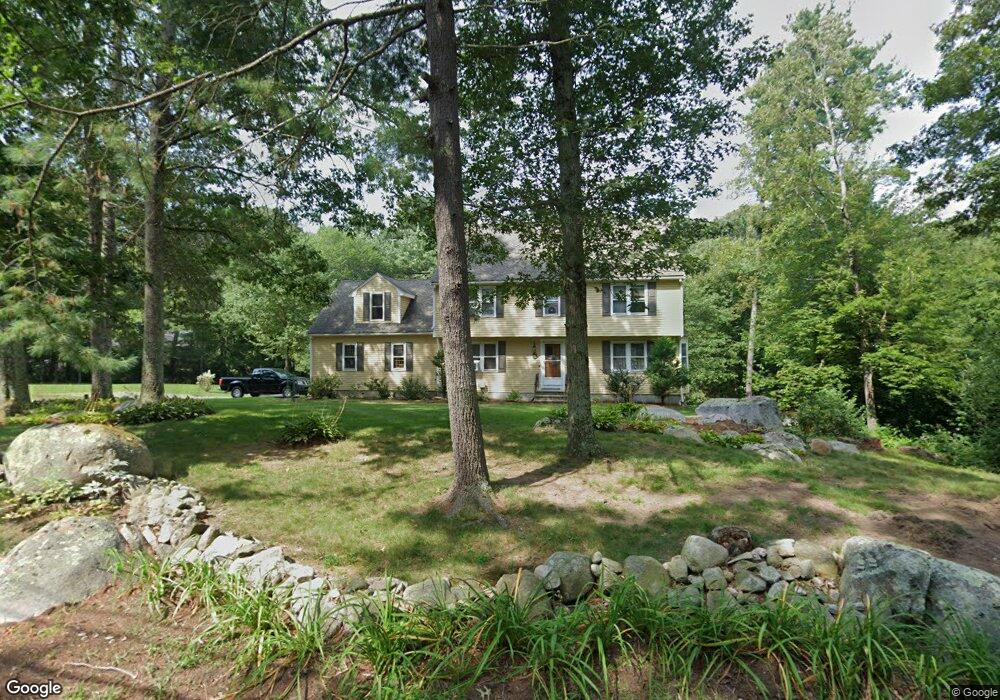
12 Granite St Medway, MA 02053
Estimated Value: $762,602 - $967,000
4
Beds
3
Baths
2,617
Sq Ft
$319/Sq Ft
Est. Value
About This Home
This home is located at 12 Granite St, Medway, MA 02053 and is currently estimated at $834,901, approximately $319 per square foot. 12 Granite St is a home located in Norfolk County with nearby schools including John D. McGovern Elementary School, Burke-Memorial Elementary, and Medway Middle School.
Ownership History
Date
Name
Owned For
Owner Type
Purchase Details
Closed on
Jun 30, 1999
Sold by
Casinelli Arthur P and Casinelli Mary A
Bought by
Hammond William M and Hammond Carol A
Current Estimated Value
Home Financials for this Owner
Home Financials are based on the most recent Mortgage that was taken out on this home.
Original Mortgage
$130,000
Interest Rate
7.19%
Mortgage Type
Purchase Money Mortgage
Create a Home Valuation Report for This Property
The Home Valuation Report is an in-depth analysis detailing your home's value as well as a comparison with similar homes in the area
Home Values in the Area
Average Home Value in this Area
Purchase History
| Date | Buyer | Sale Price | Title Company |
|---|---|---|---|
| Hammond William M | $303,900 | -- |
Source: Public Records
Mortgage History
| Date | Status | Borrower | Loan Amount |
|---|---|---|---|
| Open | Hammond William M | $123,000 | |
| Closed | Hammond William M | $130,000 | |
| Previous Owner | Hammond William M | $132,600 |
Source: Public Records
Tax History
| Year | Tax Paid | Tax Assessment Tax Assessment Total Assessment is a certain percentage of the fair market value that is determined by local assessors to be the total taxable value of land and additions on the property. | Land | Improvement |
|---|---|---|---|---|
| 2025 | $9,391 | $659,000 | $329,200 | $329,800 |
| 2024 | $9,490 | $659,000 | $329,200 | $329,800 |
| 2023 | $9,444 | $592,500 | $299,700 | $292,800 |
| 2022 | $8,257 | $487,700 | $221,600 | $266,100 |
| 2021 | $8,259 | $473,000 | $206,800 | $266,200 |
| 2020 | $8,094 | $462,500 | $206,800 | $255,700 |
| 2019 | $7,620 | $449,000 | $197,500 | $251,500 |
| 2018 | $7,670 | $434,300 | $189,100 | $245,200 |
| 2017 | $7,634 | $426,000 | $184,900 | $241,100 |
| 2016 | $7,449 | $411,300 | $170,200 | $241,100 |
| 2015 | $7,387 | $405,000 | $168,100 | $236,900 |
| 2014 | $7,333 | $389,200 | $168,100 | $221,100 |
Source: Public Records
Map
Nearby Homes
- 22 Granite St
- 15 Fox Run Rd
- 42 Fisher St
- 56 Fisher St
- 28 Fisher St
- 8 Liberty Rd
- 462 Hartford Ave
- 23 Cedar Farms Rd
- 2 Kingson Ln Unit 2
- 394 Village St
- 21 Carp Rd
- 6 Freedom Trail
- 8 Apache Rd
- 56 Puddingstone Ln
- 429 South St
- 21 Maple St
- 22 Milford St
- 4 Linda Ln
- 20 Hawthorne Village Unit A
- 44 Black Bear Cir Unit 44
Your Personal Tour Guide
Ask me questions while you tour the home.