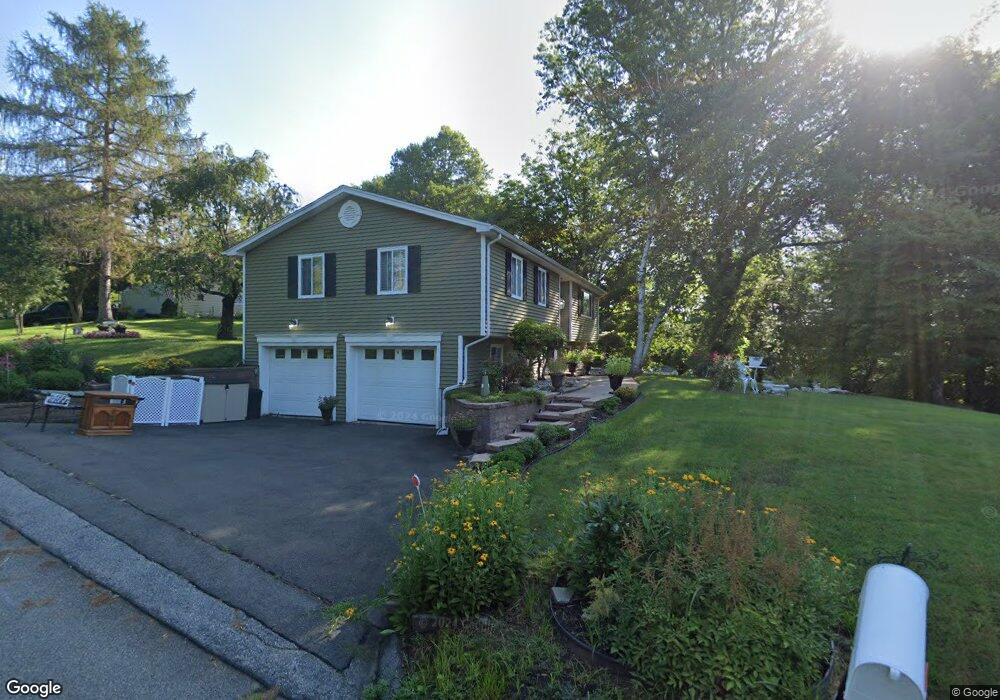
12 Green Briar Cir Middletown, CT 06457
Estimated Value: $338,248 - $376,000
3
Beds
2
Baths
1,208
Sq Ft
$296/Sq Ft
Est. Value
About This Home
This home is located at 12 Green Briar Cir, Middletown, CT 06457 and is currently estimated at $357,812, approximately $296 per square foot. 12 Green Briar Cir is a home located in Middlesex County with nearby schools including Wesley School, St John Paul II School, and Mercy High School.
Ownership History
Date
Name
Owned For
Owner Type
Purchase Details
Closed on
Sep 24, 2010
Sold by
Sebold Janet G and Sebold Thomas E
Bought by
Rice Marian
Current Estimated Value
Home Financials for this Owner
Home Financials are based on the most recent Mortgage that was taken out on this home.
Original Mortgage
$212,117
Outstanding Balance
$142,255
Interest Rate
4.75%
Mortgage Type
FHA
Estimated Equity
$215,557
Purchase Details
Closed on
Jul 31, 2006
Sold by
Wilson Stephen L and Wilson Sandra K
Bought by
Sebold Thomas E and Sebold Janet G
Home Financials for this Owner
Home Financials are based on the most recent Mortgage that was taken out on this home.
Original Mortgage
$185,500
Interest Rate
6.67%
Purchase Details
Closed on
Jun 1, 1992
Sold by
Cho Grace
Bought by
Wilson Stephen L and Wilson Sandar K
Create a Home Valuation Report for This Property
The Home Valuation Report is an in-depth analysis detailing your home's value as well as a comparison with similar homes in the area
Home Values in the Area
Average Home Value in this Area
Purchase History
| Date | Buyer | Sale Price | Title Company |
|---|---|---|---|
| Rice Marian | $215,000 | -- | |
| Sebold Thomas E | $245,000 | -- | |
| Wilson Stephen L | $125,000 | -- |
Source: Public Records
Mortgage History
| Date | Status | Borrower | Loan Amount |
|---|---|---|---|
| Open | Wilson Stephen L | $212,117 | |
| Previous Owner | Wilson Stephen L | $185,500 | |
| Previous Owner | Wilson Stephen L | $35,000 | |
| Previous Owner | Wilson Stephen L | $105,800 |
Source: Public Records
Tax History Compared to Growth
Tax History
| Year | Tax Paid | Tax Assessment Tax Assessment Total Assessment is a certain percentage of the fair market value that is determined by local assessors to be the total taxable value of land and additions on the property. | Land | Improvement |
|---|---|---|---|---|
| 2025 | $6,535 | $168,000 | $48,430 | $119,570 |
| 2024 | $6,182 | $168,000 | $48,430 | $119,570 |
| 2023 | $5,897 | $168,000 | $48,430 | $119,570 |
| 2022 | $5,212 | $118,450 | $35,880 | $82,570 |
| 2021 | $5,212 | $118,450 | $35,880 | $82,570 |
| 2020 | $5,235 | $118,450 | $35,880 | $82,570 |
| 2019 | $5,259 | $118,450 | $35,880 | $82,570 |
| 2018 | $5,176 | $118,450 | $35,880 | $82,570 |
| 2017 | $5,144 | $121,320 | $42,390 | $78,930 |
| 2016 | $4,998 | $121,320 | $42,390 | $78,930 |
| 2015 | $4,777 | $120,620 | $42,390 | $78,230 |
| 2014 | $4,825 | $120,620 | $42,390 | $78,230 |
Source: Public Records
Map
Nearby Homes
- 491 Long Hill Rd
- 30 Orange Rd Unit 30
- 753 Long Hill Rd Unit A
- 120 Scenic View Dr
- Lot 3 Coleman Rd
- 498 Pine St
- Lot 2 Coleman Rd
- (Map 12, Lot 80A) Hubbard St
- 55 Lorelei Cir
- 17 Mckenna Dr
- 9 Sunset Dr
- 40 Batt St
- 10 Lorelei Cir
- 0 Arbutus St Unit 24065180
- 574 Butternut St
- 347 Farm Hill Rd
- 81 Aresco Dr
- 128 Highland Ave
- 237 Boston Rd
- 160 Boston Rd
- 22 Green Briar Cir
- 32 Green Briar Cir
- 509 Long Hill Rd
- 7 Yellow Birch Rd
- 38 Green Briar Cir
- 6 Yellow Birch Rd
- 42 Green Briar Cir
- 8 Yellow Birch Rd
- 48 Green Briar Cir
- 528 Long Hill Rd
- 5 Yellow Birch Rd
- 520 Long Hill Rd
- 9 Yellow Birch Rd
- 512 Long Hill Rd
- 481 Long Hill Rd
- 536 Long Hill Rd
- 4 Yellow Birch Rd
- 506 Long Hill Rd
- 538 Long Hill Rd
- 500 Long Hill Rd