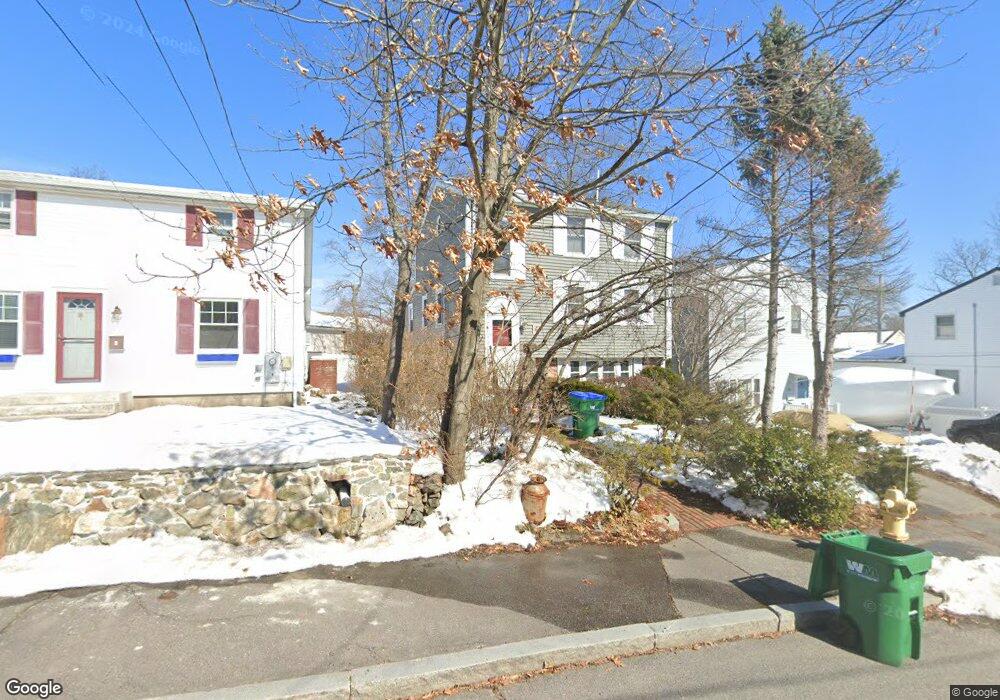
12 Greenhalge St Medford, MA 02155
North Medford NeighborhoodEstimated Value: $854,000 - $1,079,000
5
Beds
3
Baths
1,872
Sq Ft
$509/Sq Ft
Est. Value
About This Home
This home is located at 12 Greenhalge St, Medford, MA 02155 and is currently estimated at $952,268, approximately $508 per square foot. 12 Greenhalge St is a home located in Middlesex County with nearby schools including Medford High School, Mystic Valley Regional Charter School, and St. Joseph School.
Ownership History
Date
Name
Owned For
Owner Type
Purchase Details
Closed on
Feb 27, 2025
Sold by
Petrone Richard M and Petrone Mary J
Bought by
2025 Petrone Ft and Petrone
Current Estimated Value
Purchase Details
Closed on
Feb 18, 1986
Bought by
Petrone Richard M and Dello Russo Mary Jo
Create a Home Valuation Report for This Property
The Home Valuation Report is an in-depth analysis detailing your home's value as well as a comparison with similar homes in the area
Home Values in the Area
Average Home Value in this Area
Purchase History
| Date | Buyer | Sale Price | Title Company |
|---|---|---|---|
| 2025 Petrone Ft | -- | None Available | |
| 2025 Petrone Ft | -- | None Available | |
| Petrone Richard M | $120,000 | -- |
Source: Public Records
Mortgage History
| Date | Status | Borrower | Loan Amount |
|---|---|---|---|
| Previous Owner | Petrone Richard M | $75,000 | |
| Previous Owner | Petrone Richard M | $115,000 | |
| Previous Owner | Petrone Richard M | $89,000 |
Source: Public Records
Tax History Compared to Growth
Tax History
| Year | Tax Paid | Tax Assessment Tax Assessment Total Assessment is a certain percentage of the fair market value that is determined by local assessors to be the total taxable value of land and additions on the property. | Land | Improvement |
|---|---|---|---|---|
| 2025 | $7,551 | $858,100 | $330,700 | $527,400 |
| 2024 | $7,106 | $834,000 | $314,900 | $519,100 |
| 2023 | $6,784 | $784,300 | $294,300 | $490,000 |
| 2022 | $6,676 | $741,000 | $267,600 | $473,400 |
| 2021 | $6,158 | $654,400 | $254,800 | $399,600 |
| 2020 | $6,044 | $658,400 | $254,800 | $403,600 |
| 2019 | $5,899 | $614,500 | $231,600 | $382,900 |
| 2018 | $5,831 | $569,400 | $210,600 | $358,800 |
| 2017 | $5,733 | $542,900 | $196,800 | $346,100 |
| 2016 | $5,287 | $472,500 | $178,900 | $293,600 |
| 2015 | $5,039 | $430,700 | $170,400 | $260,300 |
Source: Public Records
Map
Nearby Homes