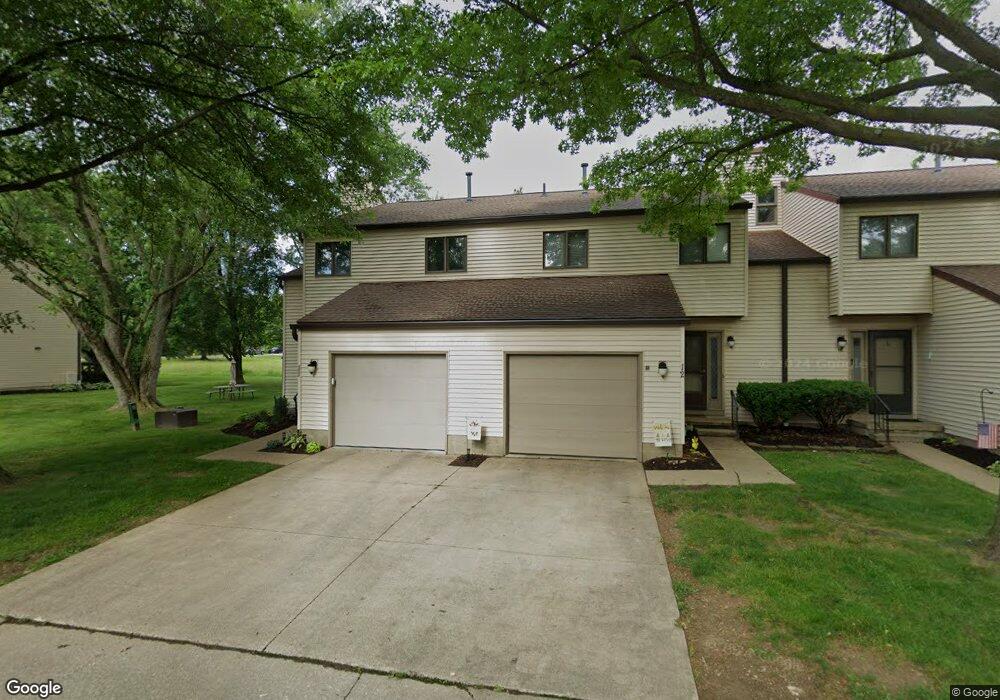
12 Greenwood Dr Unit 2D Doylestown, OH 44230
Estimated Value: $122,000 - $178,569
3
Beds
2
Baths
1,496
Sq Ft
$94/Sq Ft
Est. Value
About This Home
This home is located at 12 Greenwood Dr Unit 2D, Doylestown, OH 44230 and is currently estimated at $140,642, approximately $94 per square foot. 12 Greenwood Dr Unit 2D is a home located in Wayne County with nearby schools including Hazel Harvey Elementary School, Chippewa Intermediate School, and Chippewa Jr./Sr. High School.
Ownership History
Date
Name
Owned For
Owner Type
Purchase Details
Closed on
Jul 1, 2004
Sold by
Jakab Sandor J and Jakab Sherri M
Bought by
Darnell Vicki R
Current Estimated Value
Home Financials for this Owner
Home Financials are based on the most recent Mortgage that was taken out on this home.
Original Mortgage
$97,000
Outstanding Balance
$48,460
Interest Rate
6.22%
Mortgage Type
Unknown
Estimated Equity
$92,182
Purchase Details
Closed on
Oct 9, 1997
Sold by
Smith Debra A
Bought by
Jakab Sandor J
Home Financials for this Owner
Home Financials are based on the most recent Mortgage that was taken out on this home.
Original Mortgage
$71,550
Interest Rate
7.7%
Mortgage Type
Balloon
Purchase Details
Closed on
May 5, 1994
Sold by
Lorenzen Richard P and Lorenzen Dian
Bought by
Smith Debra A and Smith John G
Purchase Details
Closed on
Jul 19, 1991
Bought by
Lorenzen Richard P and Lorenzen Dian
Create a Home Valuation Report for This Property
The Home Valuation Report is an in-depth analysis detailing your home's value as well as a comparison with similar homes in the area
Home Values in the Area
Average Home Value in this Area
Purchase History
| Date | Buyer | Sale Price | Title Company |
|---|---|---|---|
| Darnell Vicki R | $97,000 | Midland Title | |
| Jakab Sandor J | $79,500 | -- | |
| Smith Debra A | $77,000 | -- | |
| Lorenzen Richard P | $60,000 | -- |
Source: Public Records
Mortgage History
| Date | Status | Borrower | Loan Amount |
|---|---|---|---|
| Open | Darnell Vicki R | $97,000 | |
| Previous Owner | Jakab Sandor J | $71,550 |
Source: Public Records
Tax History Compared to Growth
Tax History
| Year | Tax Paid | Tax Assessment Tax Assessment Total Assessment is a certain percentage of the fair market value that is determined by local assessors to be the total taxable value of land and additions on the property. | Land | Improvement |
|---|---|---|---|---|
| 2024 | $1,747 | $47,550 | $3,030 | $44,520 |
| 2023 | $1,747 | $47,550 | $3,030 | $44,520 |
| 2022 | $1,438 | $35,760 | $2,280 | $33,480 |
| 2021 | $1,448 | $35,760 | $2,280 | $33,480 |
| 2020 | $1,459 | $35,760 | $2,280 | $33,480 |
| 2019 | $1,406 | $33,210 | $2,370 | $30,840 |
| 2018 | $1,419 | $33,210 | $2,370 | $30,840 |
| 2017 | $1,408 | $33,210 | $2,370 | $30,840 |
| 2016 | $1,374 | $31,930 | $2,280 | $29,650 |
| 2015 | $1,368 | $31,930 | $2,280 | $29,650 |
| 2014 | $1,211 | $31,930 | $2,280 | $29,650 |
| 2013 | $1,318 | $33,780 | $2,300 | $31,480 |
Source: Public Records
Map
Nearby Homes
- 0 Akron Rd Unit 5123781
- 500 W Clinton St
- 0 S Portage St
- 15041 Doylestown Rd
- 15500 Freedom Dr
- 340 Gates St
- 270 Maple St
- 436 N Portage St
- 77 Koehler Ave
- 154 Circle Dr
- 517 N Portage St
- 485 E Clinton St
- 680 Thorn Way
- 620 Thorn Way
- 104 Homan Dr
- V/L approx 67.56ac Gates St
- 46 Hidden Pond Dr
- 580 Thorn Way
- VL 1067 Homan Dr
- 325 Catawba Path
- 11 Greenwood Dr Unit 1D
- 13 Greenwood Dr
- 14 Greenwood Dr
- 4 Greenwood Dr Unit 4A
- 16 Greenwood Dr Unit 2C
- 15 Greenwood Dr
- 17 Greenwood Dr Unit 3C
- 18 Greenwood Dr Unit 4C
- 10 Greenwood Dr Unit 6B
- 3 Greenwood Dr Unit 3A
- 9 Greenwood Dr Unit 5B
- 19 Greenwood Dr Unit 5C
- 20 Greenwood Dr
- 20 Greenwood Dr Unit 6C
- 20 Greenwood Dr Unit C
- 8 Greenwood Dr Unit 4B
- 2 Greenwood Dr Unit 2A
- 21 Greenwood Dr Unit 7C
- 7 Greenwood Dr Unit 3B
- 1 Greenwood Dr