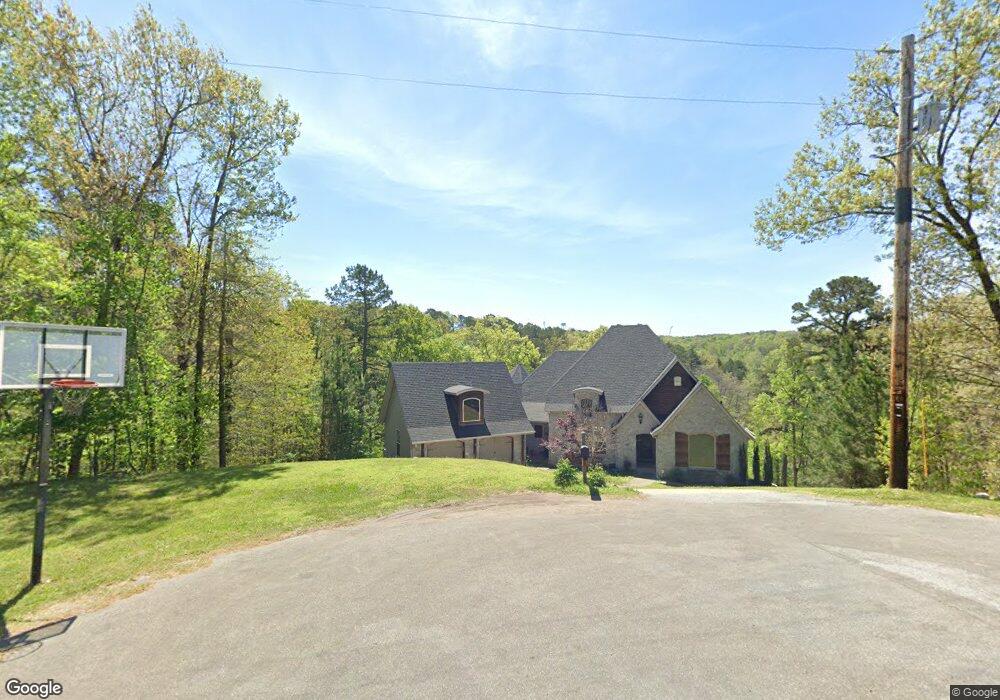
12 Gribbin Ln Bella Vista, AR 72714
Estimated Value: $479,000 - $662,000
--
Bed
4
Baths
1,976
Sq Ft
$310/Sq Ft
Est. Value
About This Home
This home is located at 12 Gribbin Ln, Bella Vista, AR 72714 and is currently estimated at $612,503, approximately $309 per square foot. 12 Gribbin Ln is a home located in Benton County with nearby schools including Cooper Elementary School, Old High Middle School, and Washington Junior High School.
Ownership History
Date
Name
Owned For
Owner Type
Purchase Details
Closed on
Oct 20, 2017
Sold by
Jensen Erin M
Bought by
Sperry Quintin and Sperry Hillary
Current Estimated Value
Home Financials for this Owner
Home Financials are based on the most recent Mortgage that was taken out on this home.
Original Mortgage
$279,000
Outstanding Balance
$232,793
Interest Rate
3.78%
Mortgage Type
New Conventional
Estimated Equity
$379,710
Purchase Details
Closed on
Jul 25, 2017
Sold by
Jensen Erin M and Jensen Erin
Bought by
Jensen Erin M
Purchase Details
Closed on
Jun 1, 2007
Sold by
Highlands Investment Corp Inc
Bought by
Banks Yocom Shannon and Yocom Daniel
Purchase Details
Closed on
Jun 4, 1999
Bought by
Jasan Tr
Purchase Details
Closed on
Oct 30, 1991
Bought by
Jasan
Purchase Details
Closed on
Jan 29, 1991
Bought by
Mcdonald
Purchase Details
Closed on
Jun 10, 1983
Bought by
Nacarato
Create a Home Valuation Report for This Property
The Home Valuation Report is an in-depth analysis detailing your home's value as well as a comparison with similar homes in the area
Home Values in the Area
Average Home Value in this Area
Purchase History
| Date | Buyer | Sale Price | Title Company |
|---|---|---|---|
| Sperry Quintin | $372,000 | None Available | |
| Jensen Erin M | -- | None Available | |
| Banks Yocom Shannon | $44,000 | Bronson Title Services Inc | |
| Jasan Tr | -- | -- | |
| Re: Jasan Fam Tr | -- | -- | |
| Jasan | $1,000 | -- | |
| Mcdonald | -- | -- | |
| Nacarato | -- | -- |
Source: Public Records
Mortgage History
| Date | Status | Borrower | Loan Amount |
|---|---|---|---|
| Open | Sperry Quintin | $279,000 |
Source: Public Records
Tax History Compared to Growth
Tax History
| Year | Tax Paid | Tax Assessment Tax Assessment Total Assessment is a certain percentage of the fair market value that is determined by local assessors to be the total taxable value of land and additions on the property. | Land | Improvement |
|---|---|---|---|---|
| 2025 | $4,044 | $101,770 | $1,600 | $100,170 |
| 2024 | $3,821 | $101,770 | $1,600 | $100,170 |
| 2023 | $3,639 | $69,520 | $800 | $68,720 |
| 2022 | $3,217 | $69,520 | $800 | $68,720 |
| 2021 | $3,047 | $69,520 | $800 | $68,720 |
| 2020 | $2,913 | $51,620 | $600 | $51,020 |
| 2019 | $2,913 | $51,620 | $600 | $51,020 |
| 2018 | $2,938 | $51,620 | $600 | $51,020 |
| 2017 | $2,938 | $51,620 | $600 | $51,020 |
| 2016 | $2,814 | $51,620 | $600 | $51,020 |
| 2015 | $2,985 | $49,500 | $1,000 | $48,500 |
| 2014 | $2,635 | $49,500 | $1,000 | $48,500 |
Source: Public Records
Map
Nearby Homes