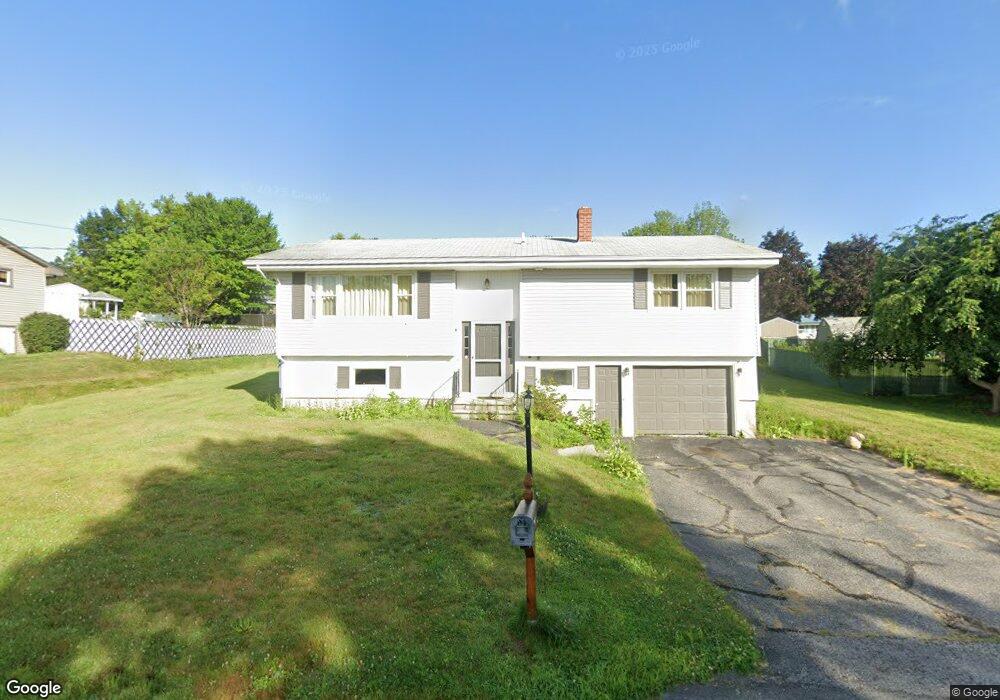
12 Grovemount Ln Lewiston, ME 04240
Estimated Value: $302,613 - $333,000
3
Beds
2
Baths
1,049
Sq Ft
$298/Sq Ft
Est. Value
About This Home
This home is located at 12 Grovemount Ln, Lewiston, ME 04240 and is currently estimated at $312,903, approximately $298 per square foot. 12 Grovemount Ln is a home located in Androscoggin County with nearby schools including Montello School, Lewiston Middle School, and Lewiston High School.
Ownership History
Date
Name
Owned For
Owner Type
Purchase Details
Closed on
May 10, 2024
Sold by
Desjardins Evan J
Bought by
Erickson Jackson
Current Estimated Value
Home Financials for this Owner
Home Financials are based on the most recent Mortgage that was taken out on this home.
Original Mortgage
$220,000
Outstanding Balance
$216,862
Interest Rate
6.79%
Mortgage Type
Purchase Money Mortgage
Estimated Equity
$96,041
Create a Home Valuation Report for This Property
The Home Valuation Report is an in-depth analysis detailing your home's value as well as a comparison with similar homes in the area
Home Values in the Area
Average Home Value in this Area
Purchase History
| Date | Buyer | Sale Price | Title Company |
|---|---|---|---|
| Erickson Jackson | $275,000 | None Available | |
| Erickson Jackson | $275,000 | None Available |
Source: Public Records
Mortgage History
| Date | Status | Borrower | Loan Amount |
|---|---|---|---|
| Open | Erickson Jackson | $220,000 | |
| Closed | Erickson Jackson | $220,000 |
Source: Public Records
Tax History Compared to Growth
Tax History
| Year | Tax Paid | Tax Assessment Tax Assessment Total Assessment is a certain percentage of the fair market value that is determined by local assessors to be the total taxable value of land and additions on the property. | Land | Improvement |
|---|---|---|---|---|
| 2024 | $2,989 | $94,080 | $24,840 | $69,240 |
| 2023 | $2,822 | $94,080 | $24,840 | $69,240 |
| 2022 | $2,681 | $94,080 | $24,840 | $69,240 |
| 2021 | $2,659 | $94,080 | $24,840 | $69,240 |
| 2020 | $2,697 | $94,080 | $24,840 | $69,240 |
| 2019 | $2,720 | $94,080 | $24,840 | $69,240 |
| 2018 | $2,697 | $94,080 | $24,840 | $69,240 |
| 2017 | $2,636 | $94,080 | $24,840 | $69,240 |
| 2016 | $2,591 | $94,080 | $24,840 | $69,240 |
| 2015 | $2,575 | $94,080 | $24,840 | $69,240 |
| 2014 | $2,502 | $94,080 | $24,840 | $69,240 |
| 2013 | $2,487 | $94,080 | $24,840 | $69,240 |
Source: Public Records
Map
Nearby Homes