12 Hancock St Newburyport, MA 01950
Estimated Value: $1,177,857 - $1,419,000
2
Beds
3
Baths
1,836
Sq Ft
$705/Sq Ft
Est. Value
About This Home
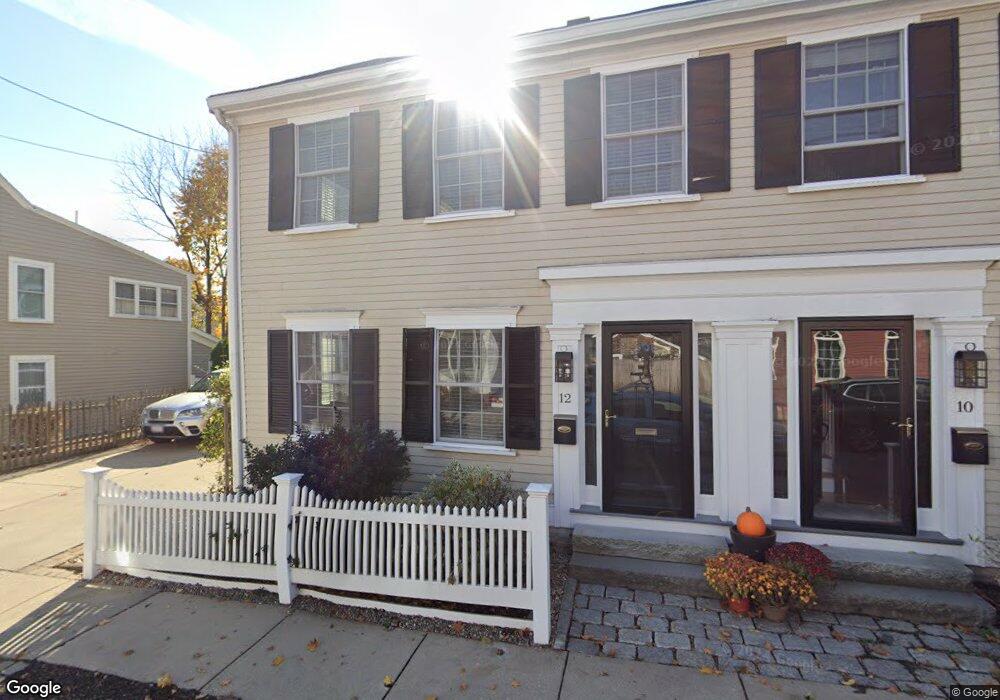
This home is located at 12 Hancock St, Newburyport, MA 01950 and is currently estimated at $1,295,214, approximately $705 per square foot. 12 Hancock St is a home located in Essex County with nearby schools including Francis T. Bresnahan Elementary School, Edward G. Molin Elementary School, and Rupert A. Nock Middle School.
Ownership History
Date
Name
Owned For
Owner Type
Purchase Details
Closed on
Apr 23, 2012
Sold by
Cuticchia Joseph M and Cuticchia Rosalie A
Bought by
Cuticchia Rt and Cuticchia Joseph M
Current Estimated Value
Home Financials for this Owner
Home Financials are based on the most recent Mortgage that was taken out on this home.
Original Mortgage
$392,000
Outstanding Balance
$270,503
Interest Rate
3.89%
Mortgage Type
New Conventional
Estimated Equity
$1,024,711
Purchase Details
Closed on
Sep 23, 2011
Sold by
Cuticchia Joseph M and Cuticchia Rosalie A
Bought by
Cuticchia Rt and Cuticchia Joseph M
Purchase Details
Closed on
Feb 1, 2005
Sold by
10-12 Hancock St Rt and Guertin Ronald P
Bought by
Cuticchia Joseph M
Create a Home Valuation Report for This Property
The Home Valuation Report is an in-depth analysis detailing your home's value as well as a comparison with similar homes in the area
Home Values in the Area
Average Home Value in this Area
Purchase History
| Date | Buyer | Sale Price | Title Company |
|---|---|---|---|
| Cuticchia Rt | -- | -- | |
| Cuticchia Joseph M | -- | -- | |
| Cuticchia Rt | -- | -- | |
| Cuticchia Joseph M | $665,000 | -- |
Source: Public Records
Mortgage History
| Date | Status | Borrower | Loan Amount |
|---|---|---|---|
| Open | Cuticchia Joseph M | $392,000 | |
| Closed | Cuticchia Joseph M | $392,000 | |
| Previous Owner | Cuticchia Joseph M | $412,000 | |
| Previous Owner | Cuticchia Joseph M | $414,000 |
Source: Public Records
Tax History Compared to Growth
Tax History
| Year | Tax Paid | Tax Assessment Tax Assessment Total Assessment is a certain percentage of the fair market value that is determined by local assessors to be the total taxable value of land and additions on the property. | Land | Improvement |
|---|---|---|---|---|
| 2025 | $9,814 | $1,024,400 | $0 | $1,024,400 |
| 2024 | $9,579 | $960,800 | $0 | $960,800 |
| 2023 | $9,542 | $888,500 | $0 | $888,500 |
| 2022 | $9,419 | $784,300 | $0 | $784,300 |
| 2021 | $9,359 | $740,400 | $0 | $740,400 |
| 2020 | $9,318 | $725,700 | $0 | $725,700 |
| 2019 | $8,995 | $687,700 | $0 | $687,700 |
| 2018 | $8,848 | $667,300 | $0 | $667,300 |
| 2017 | $8,582 | $638,100 | $0 | $638,100 |
| 2016 | $8,163 | $609,600 | $0 | $609,600 |
| 2015 | $7,777 | $583,000 | $0 | $583,000 |
Source: Public Records
Map
Nearby Homes
- 113 Prospect St Unit B
- 17 Madison St
- 57 Lime St Unit 1
- 58 Lime St Unit 5
- 164 Water St Unit A
- 166 Water St Unit B
- 26 Beacon Ave
- 42 Federal St Unit B
- 11 Orange St Unit 2
- 4 Goodwin Ave
- 33 Union St
- 1 Lancaster Rd
- 11 Charter St
- 95 High St Unit 4
- 95 High St Unit 1
- 105 State St Unit 301
- 105 State St Unit 101
- 105 State St Unit 201
- 30-32 Water St Unit 4
- 10 10th St
- 10 Hancock St
- 10 Hancock St Unit 1
- 14 Hancock St
- 8 Hancock St
- 6 Hancock St
- 3 Chestnut St
- 16 Hancock St
- 1 Chestnut St
- 7 Hancock St Unit 1
- 9 Hancock St Unit 2
- 7 Hancock St
- 13 Hancock St
- 79 Hancock St
- 11 Hancock St Unit 11R
- 11 Hancock St
- 7 Chestnut St
- 5 Chestnut St
- 5 Chestnut St Unit 1
- 5 Chestnut St
- 5 Hancock St