
Seller's Agent in 2021
Lynn Rossini
RE/MAX
1 in this area
70 Total Sales
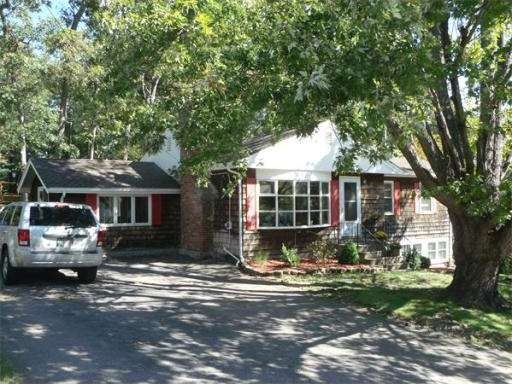
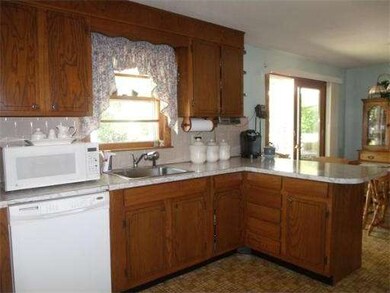
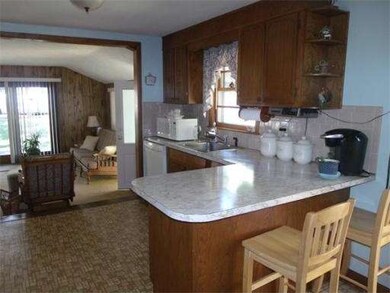
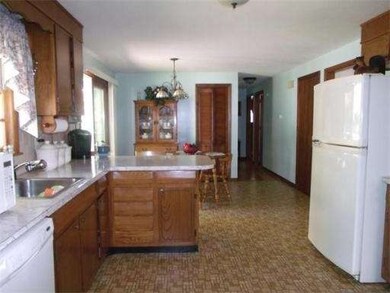
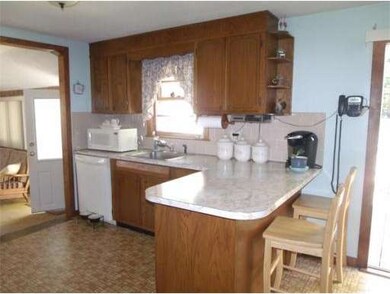
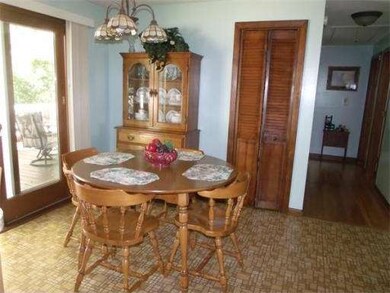
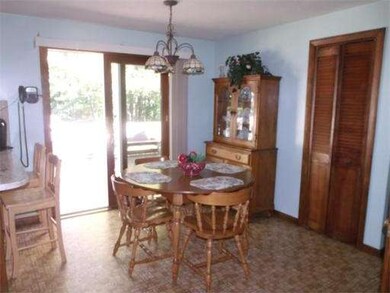
Whether You Are Downsizing or Just Starting Out, This Is The Ranch Style Home For You *New Roof, Gas Heat and Air Conditioning in 2012 *Immaculate Hardwood Bedrooms *Fireplaced Living Room and Vaulted Family Room *Sliders Off Kitchen to Oversized Deck *Bright Walk-Out Basement Offers Many Possibilities and Options. All On a Lovely Wooded Lot In a Much Desired Neighborhood. *Seller Will Entertain Offers Between $219,900 and $239,900
Last Agent to Sell the Property
Berkshire Hathaway HomeServices Commonwealth Real Estate Listed on: 09/27/2012
Home Type
Single Family
Est. Annual Taxes
$5,994
Year Built
1965
Lot Details
0
| Date | Event | Price | Change | Sq Ft Price |
|---|---|---|---|---|
| 03/29/2021 03/29/21 | Sold | $425,000 | +9.0% | $340 / Sq Ft |
| 02/23/2021 02/23/21 | Pending | -- | -- | -- |
| 02/18/2021 02/18/21 | For Sale | $389,900 | +63.8% | $312 / Sq Ft |
| 03/26/2015 03/26/15 | Sold | $238,000 | 0.0% | $190 / Sq Ft |
| 02/24/2015 02/24/15 | Pending | -- | -- | -- |
| 02/06/2015 02/06/15 | Off Market | $238,000 | -- | -- |
| 02/02/2015 02/02/15 | For Sale | $239,900 | +6.4% | $192 / Sq Ft |
| 12/14/2012 12/14/12 | Sold | $225,500 | +2.5% | $180 / Sq Ft |
| 10/22/2012 10/22/12 | Pending | -- | -- | -- |
| 09/27/2012 09/27/12 | For Sale | $219,900 | -- | $176 / Sq Ft |
| Year | Tax Paid | Tax Assessment Tax Assessment Total Assessment is a certain percentage of the fair market value that is determined by local assessors to be the total taxable value of land and additions on the property. | Land | Improvement |
|---|---|---|---|---|
| 2025 | $5,994 | $477,200 | $167,600 | $309,600 |
| 2024 | $5,747 | $446,900 | $153,000 | $293,900 |
| 2023 | $5,538 | $424,400 | $145,700 | $278,700 |
| 2022 | $5,408 | $384,100 | $121,500 | $262,600 |
| 2021 | $4,022 | $279,100 | $121,500 | $157,600 |
| 2020 | $3,807 | $267,700 | $121,500 | $146,200 |
| 2019 | $3,729 | $262,400 | $121,500 | $140,900 |
| 2018 | $3,470 | $240,800 | $116,800 | $124,000 |
| 2017 | $3,387 | $236,200 | $116,800 | $119,400 |
| 2016 | $3,250 | $227,400 | $114,900 | $112,500 |
| 2015 | $3,115 | $218,600 | $110,400 | $108,200 |
| 2014 | $3,126 | $213,200 | $107,900 | $105,300 |
Seller's Agent in 2021
Lynn Rossini
RE/MAX
1 in this area
70 Total Sales
Buyer's Agent in 2021
Cheryl Cotney
Compass
(617) 872-5539
1 in this area
27 Total Sales
Seller's Agent in 2015
Lori Rudd
RE/MAX
(508) 964-5604
2 in this area
72 Total Sales
Seller's Agent in 2012
Richard Herrick
Berkshire Hathaway HomeServices Commonwealth Real Estate
(508) 528-7777
11 in this area
33 Total Sales
Source: MLS Property Information Network (MLS PIN)
MLS Number: 71440993
APN: BELL-000055-000025
Disclaimer: Certain information contained herein is derived from information provided by parties other than Homes.com. All information provided is deemed reliable, but is not guaranteed to be accurate and should be independently verified.
![]() The property listing data and information, or the Images, set forth herein were provided to MLS Property Information Network, Inc. from third party sources, including sellers, lessors and public records, and were compiled by MLS Property Information Network, Inc. The property listing data and information, and the Images, are for the personal, non-commercial use of consumers having a good faith interest in purchasing or leasing listed properties of the type displayed to them and may not be used for any purpose other than to identify prospective properties which such consumers may have a good faith interest in purchasing or leasing. MLS Property Information Network, Inc. and its subscribers disclaim any and all representations and warranties as to the accuracy of the property listing data and information, or as to the accuracy of any of the Images, set forth herein.
The property listing data and information, or the Images, set forth herein were provided to MLS Property Information Network, Inc. from third party sources, including sellers, lessors and public records, and were compiled by MLS Property Information Network, Inc. The property listing data and information, and the Images, are for the personal, non-commercial use of consumers having a good faith interest in purchasing or leasing listed properties of the type displayed to them and may not be used for any purpose other than to identify prospective properties which such consumers may have a good faith interest in purchasing or leasing. MLS Property Information Network, Inc. and its subscribers disclaim any and all representations and warranties as to the accuracy of the property listing data and information, or as to the accuracy of any of the Images, set forth herein.