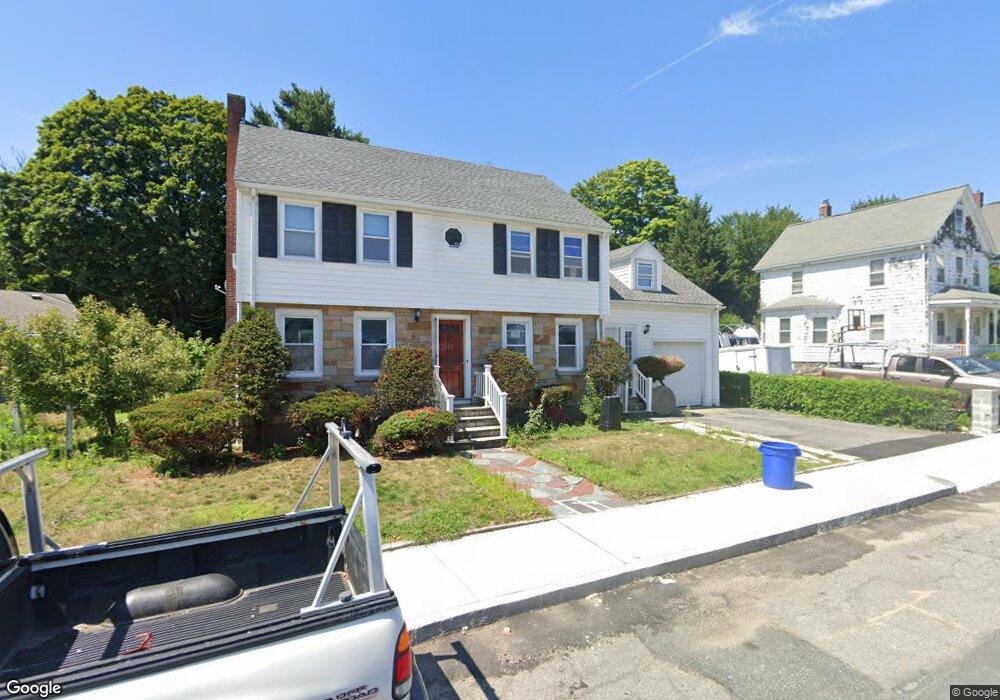
12 Harris St Quincy, MA 02169
South Quincy NeighborhoodEstimated Value: $688,000 - $813,894
3
Beds
2
Baths
1,967
Sq Ft
$392/Sq Ft
Est. Value
About This Home
This home is located at 12 Harris St, Quincy, MA 02169 and is currently estimated at $770,974, approximately $391 per square foot. 12 Harris St is a home located in Norfolk County with nearby schools including South West Middle School, Lincoln-Hancock Community School, and Quincy High School.
Ownership History
Date
Name
Owned For
Owner Type
Purchase Details
Closed on
Feb 4, 2025
Sold by
Nguyen Van
Bought by
Nguyen Loan
Current Estimated Value
Purchase Details
Closed on
Dec 8, 2005
Sold by
John J Cattaneo Jr T
Bought by
Nguyen Van
Home Financials for this Owner
Home Financials are based on the most recent Mortgage that was taken out on this home.
Original Mortgage
$316,000
Interest Rate
6.17%
Mortgage Type
Purchase Money Mortgage
Create a Home Valuation Report for This Property
The Home Valuation Report is an in-depth analysis detailing your home's value as well as a comparison with similar homes in the area
Home Values in the Area
Average Home Value in this Area
Purchase History
| Date | Buyer | Sale Price | Title Company |
|---|---|---|---|
| Nguyen Loan | -- | None Available | |
| Nguyen Van | $395,000 | -- |
Source: Public Records
Mortgage History
| Date | Status | Borrower | Loan Amount |
|---|---|---|---|
| Previous Owner | Nguyen Van | $316,000 |
Source: Public Records
Tax History Compared to Growth
Tax History
| Year | Tax Paid | Tax Assessment Tax Assessment Total Assessment is a certain percentage of the fair market value that is determined by local assessors to be the total taxable value of land and additions on the property. | Land | Improvement |
|---|---|---|---|---|
| 2025 | $8,264 | $716,700 | $312,100 | $404,600 |
| 2024 | $7,818 | $693,700 | $297,300 | $396,400 |
| 2023 | $7,256 | $651,900 | $283,200 | $368,700 |
| 2022 | $6,897 | $575,700 | $226,500 | $349,200 |
| 2021 | $6,756 | $556,500 | $226,500 | $330,000 |
| 2020 | $6,676 | $537,100 | $226,500 | $310,600 |
| 2019 | $6,138 | $489,100 | $220,000 | $269,100 |
| 2018 | $6,034 | $452,300 | $203,700 | $248,600 |
| 2017 | $5,940 | $419,200 | $194,000 | $225,200 |
| 2016 | $5,674 | $395,100 | $176,400 | $218,700 |
| 2015 | $5,357 | $366,900 | $166,400 | $200,500 |
| 2014 | $5,222 | $351,400 | $166,400 | $185,000 |
Source: Public Records
Map
Nearby Homes
- 211 Copeland St
- 73 Connell St
- 1 Cityview Ln Unit 506
- 1 Cityview Ln Unit 210
- 1 Cityview Ln Unit 709
- 1 Cityview Ln Unit 204
- 10 White St
- 46 Suomi Rd
- 46 Suomi Rd Unit 46
- 46-48 Buckley St
- 57 Buckley St
- 25 Carrolls Ln
- 42 West St
- 510 Willard St
- 14 Arthur Ave
- 12 Arthur Ave
- 29 Oconnell Ave
- 21 Arthur St
- 66 Unity St
- 89 Puritan Dr
- 1132 Furnace Brook Pkwy
- 20 Harris St
- 1124 Furnace Brook Pkwy
- 1138 Furnace Brook Pkwy
- 1122 Furnace Brook Pkwy
- 24 Harris St
- 15 Harris St
- 17 Harris St
- 13 Harris St
- 11 Harris St
- 5 Harris St
- 100 Dayton St
- 21 Harris St
- 35 Reardon St
- 30 Harris St
- 25 Harris St
- 25 Harris St Unit 1
- 94 Dayton St
- 29 Reardon St
- 1144 Furnace Brook Pkwy