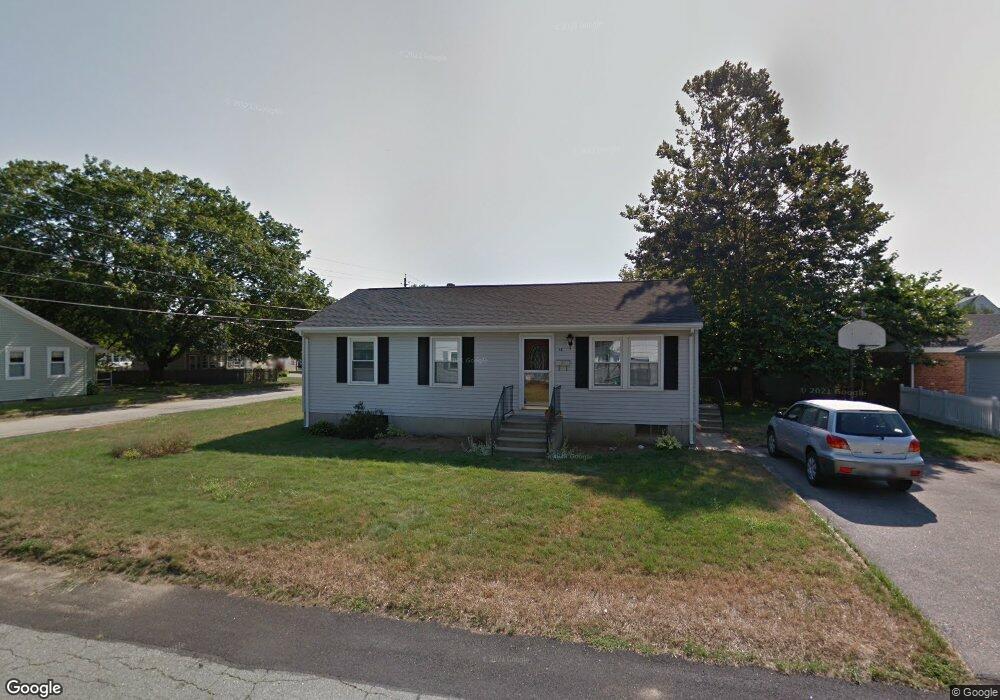
12 Harvard St Riverside, RI 02915
Riverside NeighborhoodEstimated Value: $400,119 - $464,000
3
Beds
1
Bath
960
Sq Ft
$453/Sq Ft
Est. Value
About This Home
This home is located at 12 Harvard St, Riverside, RI 02915 and is currently estimated at $434,780, approximately $452 per square foot. 12 Harvard St is a home located in Providence County with nearby schools including East Providence High School, St Luke Elementary School, and St Mary Academy-Bay View.
Ownership History
Date
Name
Owned For
Owner Type
Purchase Details
Closed on
Jan 12, 2024
Sold by
Goggin Marcia A
Bought by
Goggin Ft and Goggin
Current Estimated Value
Purchase Details
Closed on
Dec 19, 2012
Sold by
Goggin Daniel J and Goggin Marcia A
Bought by
Goggin Marcia A
Purchase Details
Closed on
Dec 9, 1988
Sold by
Schifino William
Bought by
Goggin Daniel
Create a Home Valuation Report for This Property
The Home Valuation Report is an in-depth analysis detailing your home's value as well as a comparison with similar homes in the area
Home Values in the Area
Average Home Value in this Area
Purchase History
| Date | Buyer | Sale Price | Title Company |
|---|---|---|---|
| Goggin Ft | -- | None Available | |
| Goggin Marcia A | -- | -- | |
| Goggin Daniel | $26,000 | -- |
Source: Public Records
Mortgage History
| Date | Status | Borrower | Loan Amount |
|---|---|---|---|
| Previous Owner | Goggin Daniel | $100,000 | |
| Previous Owner | Goggin Daniel | $50,000 | |
| Previous Owner | Goggin Daniel | $10,000 |
Source: Public Records
Tax History
| Year | Tax Paid | Tax Assessment Tax Assessment Total Assessment is a certain percentage of the fair market value that is determined by local assessors to be the total taxable value of land and additions on the property. | Land | Improvement |
|---|---|---|---|---|
| 2025 | $4,967 | $380,000 | $127,200 | $252,800 |
| 2024 | $4,938 | $322,100 | $106,000 | $216,100 |
| 2023 | $4,754 | $322,100 | $106,000 | $216,100 |
| 2022 | $4,569 | $209,000 | $57,800 | $151,200 |
| 2021 | $4,494 | $209,000 | $57,100 | $151,900 |
| 2020 | $4,303 | $209,000 | $57,100 | $151,900 |
| 2019 | $4,184 | $209,000 | $57,100 | $151,900 |
| 2018 | $3,782 | $165,300 | $55,500 | $109,800 |
| 2017 | $3,698 | $165,300 | $55,500 | $109,800 |
| 2016 | $3,680 | $165,300 | $55,500 | $109,800 |
| 2015 | $3,599 | $156,800 | $51,300 | $105,500 |
| 2014 | $3,599 | $156,800 | $51,300 | $105,500 |
Source: Public Records
Map
Nearby Homes
- 25 Winslow St
- 14 Benedict St
- 14 Winthrop St
- 103 Burnside Ave
- 151 Willett Ave Unit 2
- 15 Plaza Dr
- 85 Hilton Ave
- 15 Claire St
- 33 Pine St Unit 35
- 10 Booth Ave
- 28 Jefferson Ave
- 23 Albert Ave
- 72 Stowe Ave
- 6 Hazelton Rd
- 43 Bullocks Point Ave Unit 4A
- 65 Estrell Dr
- 41 White Ave
- 25 Bullocks Point Ave Unit 5C
- 33 Bullocks Point Ave Unit 5C
- 6 Fuller Ave
Your Personal Tour Guide
Ask me questions while you tour the home.